BELLINGHAM, WA ZIP Code
| City | BELLINGHAM |
| State | Washington |
| ZIP Codes count | 5 (see all) |
| Post offices count | 3 (see all) |
| Total population | 87,071 (see all) |
ZIP Codes in BELLINGHAM, Washington
The ZIP Codes in BELLINGHAM, Washington fall within the range from 98225 to 98229. BELLINGHAM is covered by 5 ZIP Codes: 3 Standard and 2 PO Box. Below is the complete list:
98225, 98226, 98227, 98228, 98229
This list contains only 5-digit ZIP codes. Use our zip code lookup by address feature to get the full 9-digit (ZIP+4) code.
List of BELLINGHAM, WA ZIP Codes
| ZIP | TYPE | POPU |
|---|---|---|
| 98225 | STANDARD | 50,046 |
| 98226 | STANDARD | 45,373 |
| 98227 | PO BOX | – |
| 98228 | PO BOX | – |
| 98229 | STANDARD | 34,182 |
Post offices
BELLINGHAM — Post Office™ 315 PROSPECT ST BELLINGHAM, WA 98225-9998 |
CITY CENTER — Post Office™ 104 W MAGNOLIA ST STE 100 BELLINGHAM, WA 98225-9997 |
MOUNT BAKER — Post Office™ 3150 ORLEANS ST BELLINGHAM, WA 98226-9998 |
Envelope example
On the bottom center of the envelope, write the address you want your letter delivered to. Include the following on separate lines:
- Recipient's full name
- Full street address
- City, State, and ZIP Code
Using the same format, write the return address in the top left corner.
Using the full ZIP+4 Code when mailing via the USPS ensures the fastest, most accurate mailing possible. If you are not sure of the full 9-digit ZIP Code, use the 5-digit ZIP Code to avoid loss of letter or package.
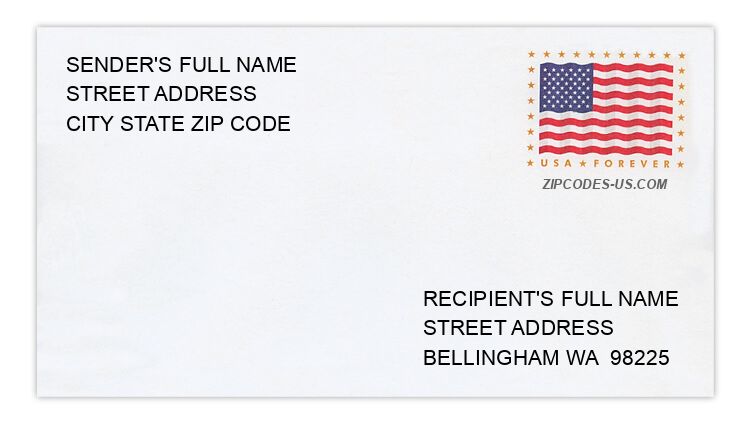
The recipient address information is provided for your reference.
Address example
3189 CEDARSIDE CT
BELLINGHAM WA 98226-3874
BELLINGHAM WA 98226-3874
179 CHUCKANUT HEIGHTS CT
BELLINGHAM WA 98229-8957
BELLINGHAM WA 98229-8957
5048 FESTIVAL BLVD
BELLINGHAM WA 98226-8071
BELLINGHAM WA 98226-8071
5579 GERARD DR
BELLINGHAM WA 98226-9631
BELLINGHAM WA 98226-9631
730 SEDONA LN
BELLINGHAM WA 98229-8212
BELLINGHAM WA 98229-8212
1095 TAKU DR
BELLINGHAM WA 98229-2788
BELLINGHAM WA 98229-2788
Map
Hover over the map to see the ZIP code
Census data for BELLINGHAM, WA
Demographic and housing estimates in BELLINGHAM, WA
| Total population | 87,071 |
| Male | 42,987 |
| Female | 44,084 |
| Total population | 87,071 |
| Under 5 years | 3,639 |
| 5 to 9 years | 3,905 |
| 10 to 14 years | 3,821 |
| 15 to 19 years | 7,088 |
| 20 to 24 years | 16,502 |
| 25 to 34 years | 13,294 |
| 35 to 44 years | 9,715 |
| 45 to 54 years | 7,891 |
| 55 to 59 years | 4,442 |
| 60 to 64 years | 4,473 |
| 65 to 74 years | 7,121 |
| 75 to 84 years | 3,236 |
| 85 years and over | 1,944 |
| Median age (years) | 30.8 |
| Under 18 years | 13,364 |
| 16 years and over | 75,031 |
| 18 years and over | 73,707 |
| 21 years and over | 64,741 |
| 62 years and over | 15,178 |
| 65 years and over | 12,301 |
| Total population | 87,071 |
| One race | 82,779 |
| White | 71,808 |
| Black or African American | 1,357 |
| American Indian and Alaska Native | 1,159 |
| Asian | 5,550 |
| Native Hawaiian and Other Pacific Islander | 181 |
| Some other race | 2,724 |
| Two or more races | 4,292 |
| Citizen, VOTING AGE 18 and over population | 69,682 |
| Male Citizen, VOTING AGE 18 and over population | 34,264 |
| Female Citizen, VOTING AGE 18 and over population | 35,418 |
Social characteristics in BELLINGHAM, WA
| Total households | 35,694 |
| Family households (families) | 16,440 |
| Married-couple family | 12,208 |
| Male householder, no wife present, family | 1,268 |
| Female householder, no husband present, family | 2,964 |
| Nonfamily households | 19,254 |
| Average household size | 2.31 |
| Average family size | 2.90 |
Economic characteristics in BELLINGHAM, WA
| Total households | 35,694 |
| Less than $10,000 | 3,291 |
| $10,000 to $14,999 | 2,024 |
| $15,000 to $24,999 | 4,006 |
| $25,000 to $34,999 | 4,084 |
| $35,000 to $49,999 | 4,223 |
| $50,000 to $74,999 | 6,784 |
| $75,000 to $99,999 | 4,119 |
| $100,000 to $149,999 | 3,785 |
| $150,000 to $199,999 | 1,911 |
| $200,000 or more | 1,467 |
| Median household income (dollars) | 50,844 |
Housing characteristics in BELLINGHAM, WA
| Total housing units | 37,831 |
| Occupied housing units | 35,694 |
| Vacant housing units | 2,137 |
| Total housing units | 37,831 |
| 1-unit, detached | 17,907 |
| 1-unit, attached | 1,365 |
| 2 units | 1,824 |
| 3 or 4 units | 2,734 |
| 5 to 9 units | 2,637 |
| 10 to 19 units | 3,416 |
| 20 or more units | 7,041 |
| Mobile home | 880 |
| Boat, RV, van, etc. | 27 |
| Total housing units | 37,831 |
| Built 2014 or later | 1,023 |
| Built 2010 to 2013 | 539 |
| Built 2000 to 2009 | 5,796 |
| Built 1990 to 1999 | 7,528 |
| Built 1980 to 1989 | 4,024 |
| Built 1970 to 1979 | 5,831 |
| Built 1960 to 1969 | 2,449 |
| Built 1950 to 1959 | 2,054 |
| Built 1940 to 1949 | 1,101 |
| Built 1939 or earlier | 7,486 |
| Total housing units | 37,831 |
| 1 room | 2,367 |
| 2 rooms | 2,223 |
| 3 rooms | 5,371 |
| 4 rooms | 7,523 |
| 5 rooms | 6,279 |
| 6 rooms | 4,941 |
| 7 rooms | 3,724 |
| 8 rooms | 2,512 |
| 9 rooms or more | 2,891 |
| Median rooms | 4.7 |
| Total housing units | 37,831 |
| No bedroom | 2,684 |
| 1 bedroom | 5,511 |
| 2 bedrooms | 12,781 |
| 3 bedrooms | 11,016 |
| 4 bedrooms | 4,824 |
| 5 or more bedrooms | 1,015 |
| Occupied housing units | 35,694 |
| Owner-occupied | 16,097 |
| Renter-occupied | 19,597 |
| Average household size of owner-occupied unit | 2.45 |
| Average household size of renter-occupied unit | 2.18 |
| Occupied housing units | 35,694 |
| Moved in 2017 or later | 3,168 |
| Moved in 2015 to 2016 | 6,712 |
| Moved in 2010 to 2014 | 11,959 |
| Moved in 2000 to 2009 | 7,954 |
| Moved in 1990 to 1999 | 3,286 |
| Moved in 1989 and earlier | 2,615 |
| Owner-occupied units | 16,097 |
| Less than $50,000 | 668 |
| $50,000 to $99,999 | 316 |
| $100,000 to $149,999 | 504 |
| $150,000 to $199,999 | 1,042 |
| $200,000 to $299,999 | 3,482 |
| $300,000 to $499,999 | 6,577 |
| $500,000 to $999,999 | 3,135 |
| $1,000,000 or more | 373 |
| Median (dollars) | 347,100 |
| Owner-occupied units | 16,097 |
| Housing units with a mortgage | 10,122 |
| Housing units without a mortgage | 5,975 |
| Occupied units paying rent | 19,198 |
| Less than $500 | 1,198 |
| $500 to $999 | 8,431 |
| $1,000 to $1,499 | 5,909 |
| $1,500 to $1,999 | 2,346 |
| $2,000 to $2,499 | 850 |
| $2,500 to $2,999 | 164 |
| $3,000 or more | 300 |
| Median (dollars) | 999 |
| No rent paid | 399 |
Data is based on 2018 Census
ZIP Codes for other locations
State for BELLINGHAM
Washington ZIP CodesOther cities in Washington