GRAHAM, WA ZIP Code
| City | GRAHAM |
| State | Washington |
| ZIP Codes count | 1 (see all) |
| Post offices count | 1 (see all) |
| Total population | 28,194 (see all) |
ZIP Code in GRAHAM, Washington
98338
This list contains only 5-digit ZIP codes. Use our zip code lookup by address feature to get the full 9-digit (ZIP+4) code.
List of GRAHAM, WA ZIP Codes
| ZIP | TYPE | POPU |
|---|---|---|
| 98338 | STANDARD | 31,996 |
Post offices
GRAHAM — Post Office™ 10102 224TH ST E GRAHAM, WA 98338-9997 |
Envelope example
On the bottom center of the envelope, write the address you want your letter delivered to. Include the following on separate lines:
- Recipient's full name
- Full street address
- City, State, and ZIP Code
Using the same format, write the return address in the top left corner.
Using the full ZIP+4 Code when mailing via the USPS ensures the fastest, most accurate mailing possible. If you are not sure of the full 9-digit ZIP Code, use the 5-digit ZIP Code to avoid loss of letter or package.
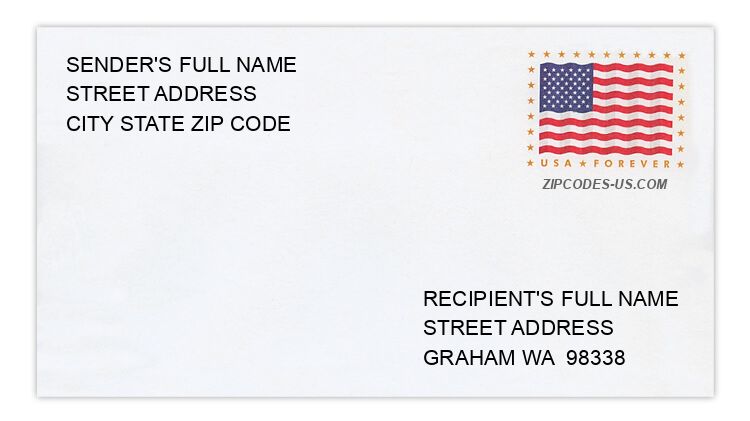
The recipient address information is provided for your reference.
Address example
28108 121ST AVE E
GRAHAM WA 98338-6105
GRAHAM WA 98338-6105
28217 164TH AVE E
GRAHAM WA 98338-6978
GRAHAM WA 98338-6978
15686 248TH ST E
GRAHAM WA 98338-7276
GRAHAM WA 98338-7276
9418 262ND ST E
GRAHAM WA 98338-9839
GRAHAM WA 98338-9839
23685 64TH AVENUE CT E
GRAHAM WA 98338-9494
GRAHAM WA 98338-9494
22138 73RD AVE E
GRAHAM WA 98338-9231
GRAHAM WA 98338-9231
Map
Hover over the map to see the ZIP code
Census data for GRAHAM, WA
Demographic and housing estimates in GRAHAM, WA
| Total population | 28,194 |
| Male | 14,129 |
| Female | 14,065 |
| Total population | 28,194 |
| Under 5 years | 2,026 |
| 5 to 9 years | 2,154 |
| 10 to 14 years | 2,781 |
| 15 to 19 years | 2,079 |
| 20 to 24 years | 1,682 |
| 25 to 34 years | 3,755 |
| 35 to 44 years | 3,933 |
| 45 to 54 years | 3,789 |
| 55 to 59 years | 1,747 |
| 60 to 64 years | 1,488 |
| 65 to 74 years | 1,671 |
| 75 to 84 years | 956 |
| 85 years and over | 133 |
| Median age (years) | 34.2 |
| Under 18 years | 8,232 |
| 16 years and over | 20,780 |
| 18 years and over | 19,962 |
| 21 years and over | 18,871 |
| 62 years and over | 3,574 |
| 65 years and over | 2,760 |
| Total population | 28,194 |
| One race | 26,420 |
| White | 22,798 |
| Black or African American | 1,179 |
| American Indian and Alaska Native | 618 |
| Asian | 836 |
| Native Hawaiian and Other Pacific Islander | 312 |
| Some other race | 677 |
| Two or more races | 1,774 |
| Citizen, VOTING AGE 18 and over population | 19,478 |
| Male Citizen, VOTING AGE 18 and over population | 9,714 |
| Female Citizen, VOTING AGE 18 and over population | 9,764 |
Social characteristics in GRAHAM, WA
| Total households | 8,992 |
| Family households (families) | 7,219 |
| Married-couple family | 6,060 |
| Male householder, no wife present, family | 307 |
| Female householder, no husband present, family | 852 |
| Nonfamily households | 1,773 |
| Average household size | 3.12 |
| Average family size | 3.46 |
Economic characteristics in GRAHAM, WA
| Total households | 8,992 |
| Less than $10,000 | 236 |
| $10,000 to $14,999 | 174 |
| $15,000 to $24,999 | 269 |
| $25,000 to $34,999 | 314 |
| $35,000 to $49,999 | 1,107 |
| $50,000 to $74,999 | 1,821 |
| $75,000 to $99,999 | 1,774 |
| $100,000 to $149,999 | 2,190 |
| $150,000 to $199,999 | 748 |
| $200,000 or more | 359 |
| Median household income (dollars) | 81,453 |
Housing characteristics in GRAHAM, WA
| Total housing units | 9,508 |
| Occupied housing units | 8,992 |
| Vacant housing units | 516 |
| Total housing units | 9,508 |
| 1-unit, detached | 7,180 |
| 1-unit, attached | 237 |
| 2 units | 69 |
| 3 or 4 units | 17 |
| 5 to 9 units | 32 |
| 10 to 19 units | 124 |
| 20 or more units | 45 |
| Mobile home | 1,791 |
| Boat, RV, van, etc. | 13 |
| Total housing units | 9,508 |
| Built 2014 or later | 260 |
| Built 2010 to 2013 | 926 |
| Built 2000 to 2009 | 2,745 |
| Built 1990 to 1999 | 2,930 |
| Built 1980 to 1989 | 1,272 |
| Built 1970 to 1979 | 757 |
| Built 1960 to 1969 | 261 |
| Built 1950 to 1959 | 133 |
| Built 1940 to 1949 | 105 |
| Built 1939 or earlier | 119 |
| Total housing units | 9,508 |
| 1 room | 96 |
| 2 rooms | 38 |
| 3 rooms | 137 |
| 4 rooms | 772 |
| 5 rooms | 2,167 |
| 6 rooms | 2,007 |
| 7 rooms | 1,685 |
| 8 rooms | 1,202 |
| 9 rooms or more | 1,404 |
| Median rooms | 6.3 |
| Total housing units | 9,508 |
| No bedroom | 113 |
| 1 bedroom | 50 |
| 2 bedrooms | 1,131 |
| 3 bedrooms | 5,207 |
| 4 bedrooms | 2,518 |
| 5 or more bedrooms | 489 |
| Occupied housing units | 8,992 |
| Owner-occupied | 7,617 |
| Renter-occupied | 1,375 |
| Average household size of owner-occupied unit | 3.09 |
| Average household size of renter-occupied unit | 3.34 |
| Occupied housing units | 8,992 |
| Moved in 2017 or later | 378 |
| Moved in 2015 to 2016 | 1,015 |
| Moved in 2010 to 2014 | 2,634 |
| Moved in 2000 to 2009 | 2,824 |
| Moved in 1990 to 1999 | 1,350 |
| Moved in 1989 and earlier | 791 |
| Owner-occupied units | 7,617 |
| Less than $50,000 | 406 |
| $50,000 to $99,999 | 289 |
| $100,000 to $149,999 | 326 |
| $150,000 to $199,999 | 807 |
| $200,000 to $299,999 | 3,110 |
| $300,000 to $499,999 | 2,221 |
| $500,000 to $999,999 | 394 |
| $1,000,000 or more | 64 |
| Median (dollars) | 264,500 |
| Owner-occupied units | 7,617 |
| Housing units with a mortgage | 5,724 |
| Housing units without a mortgage | 1,893 |
| Occupied units paying rent | 1,300 |
| Less than $500 | 10 |
| $500 to $999 | 190 |
| $1,000 to $1,499 | 334 |
| $1,500 to $1,999 | 511 |
| $2,000 to $2,499 | 234 |
| $2,500 to $2,999 | 8 |
| $3,000 or more | 13 |
| Median (dollars) | 1,614 |
| No rent paid | 75 |
Data is based on 2018 Census
ZIP Codes for other locations
State for GRAHAM
Washington ZIP CodesOther cities in Washington