WINLOCK, WA ZIP Code
| City | WINLOCK |
| State | Washington |
| ZIP Codes count | 1 (see all) |
| Post offices count | 1 (see all) |
| Total population | 1,725 (see all) |
ZIP Code in WINLOCK, Washington
98596
This list contains only 5-digit ZIP codes. Use our zip code lookup by address feature to get the full 9-digit (ZIP+4) code.
List of WINLOCK, WA ZIP Codes
| ZIP | TYPE | POPU |
|---|---|---|
| 98596 | STANDARD | 7,856 |
Post offices
WINLOCK — Post Office™ 220 NE 1ST ST WINLOCK, WA 98596-9900 |
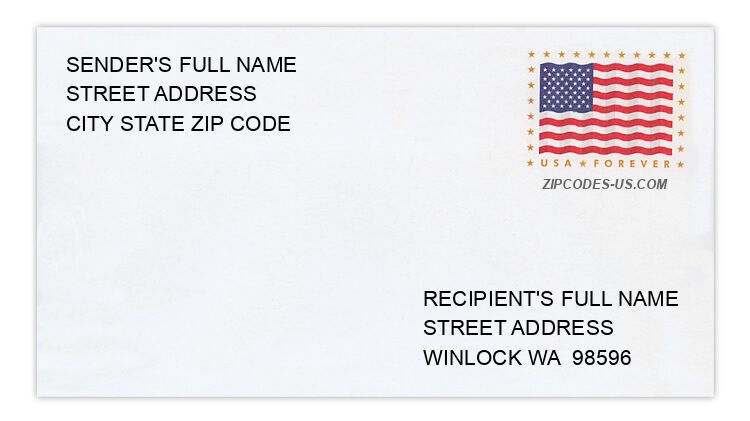
Envelope example
On the bottom center of the envelope, write the address you want your letter delivered to. Include the following on separate lines:
- Recipient's full name
- Full street address
- City, State, and ZIP Code
Using the same format, write the return address in the top left corner.
Using the full ZIP+4 Code when mailing via the USPS ensures the fastest, most accurate mailing possible. If you are not sure of the full 9-digit ZIP Code, use the 5-digit ZIP Code to avoid loss of letter or package.
The recipient address information is provided for your reference.
Address example
180 DRAWS LN
WINLOCK WA 98596-9785
WINLOCK WA 98596-9785
150 GRANDE VISTA DR
WINLOCK WA 98596-9535
WINLOCK WA 98596-9535
134 HALE RD E
WINLOCK WA 98596-9720
WINLOCK WA 98596-9720
244 JORDAN RD
WINLOCK WA 98596-9672
WINLOCK WA 98596-9672
232 SE ASH ST
WINLOCK WA 98596-9496
WINLOCK WA 98596-9496
189 SE CHURCH ST
WINLOCK WA 98596-9370
WINLOCK WA 98596-9370
Map
Hover over the map to see the ZIP code
Census data for WINLOCK, WA
Demographic and housing estimates in WINLOCK, WA
| Total population | 1,725 |
| Male | 900 |
| Female | 825 |
| Total population | 1,725 |
| Under 5 years | 152 |
| 5 to 9 years | 112 |
| 10 to 14 years | 122 |
| 15 to 19 years | 137 |
| 20 to 24 years | 177 |
| 25 to 34 years | 218 |
| 35 to 44 years | 238 |
| 45 to 54 years | 168 |
| 55 to 59 years | 63 |
| 60 to 64 years | 129 |
| 65 to 74 years | 109 |
| 75 to 84 years | 76 |
| 85 years and over | 24 |
| Median age (years) | 30.4 |
| Under 18 years | 476 |
| 16 years and over | 1,313 |
| 18 years and over | 1,249 |
| 21 years and over | 1,147 |
| 62 years and over | 302 |
| 65 years and over | 209 |
| Total population | 1,725 |
| One race | 1,577 |
| White | 1,276 |
| Black or African American | 0 |
| American Indian and Alaska Native | 37 |
| Asian | 74 |
| Native Hawaiian and Other Pacific Islander | 0 |
| Some other race | 190 |
| Two or more races | 148 |
| Citizen, VOTING AGE 18 and over population | 1,132 |
| Male Citizen, VOTING AGE 18 and over population | 562 |
| Female Citizen, VOTING AGE 18 and over population | 570 |
Social characteristics in WINLOCK, WA
| Total households | 556 |
| Family households (families) | 412 |
| Married-couple family | 281 |
| Male householder, no wife present, family | 64 |
| Female householder, no husband present, family | 67 |
| Nonfamily households | 144 |
| Average household size | 3.10 |
| Average family size | 3.45 |
Economic characteristics in WINLOCK, WA
| Total households | 556 |
| Less than $10,000 | 42 |
| $10,000 to $14,999 | 23 |
| $15,000 to $24,999 | 40 |
| $25,000 to $34,999 | 69 |
| $35,000 to $49,999 | 117 |
| $50,000 to $74,999 | 105 |
| $75,000 to $99,999 | 87 |
| $100,000 to $149,999 | 67 |
| $150,000 to $199,999 | 6 |
| $200,000 or more | 0 |
| Median household income (dollars) | 49,145 |
Housing characteristics in WINLOCK, WA
| Total housing units | 623 |
| Occupied housing units | 556 |
| Vacant housing units | 67 |
| Total housing units | 623 |
| 1-unit, detached | 472 |
| 1-unit, attached | 0 |
| 2 units | 13 |
| 3 or 4 units | 0 |
| 5 to 9 units | 41 |
| 10 to 19 units | 0 |
| 20 or more units | 23 |
| Mobile home | 74 |
| Boat, RV, van, etc. | 0 |
| Total housing units | 623 |
| Built 2014 or later | 3 |
| Built 2010 to 2013 | 3 |
| Built 2000 to 2009 | 60 |
| Built 1990 to 1999 | 90 |
| Built 1980 to 1989 | 47 |
| Built 1970 to 1979 | 47 |
| Built 1960 to 1969 | 31 |
| Built 1950 to 1959 | 45 |
| Built 1940 to 1949 | 36 |
| Built 1939 or earlier | 261 |
| Total housing units | 623 |
| 1 room | 3 |
| 2 rooms | 19 |
| 3 rooms | 55 |
| 4 rooms | 74 |
| 5 rooms | 147 |
| 6 rooms | 165 |
| 7 rooms | 86 |
| 8 rooms | 60 |
| 9 rooms or more | 14 |
| Median rooms | 5.6 |
| Total housing units | 623 |
| No bedroom | 3 |
| 1 bedroom | 83 |
| 2 bedrooms | 132 |
| 3 bedrooms | 253 |
| 4 bedrooms | 104 |
| 5 or more bedrooms | 48 |
| Occupied housing units | 556 |
| Owner-occupied | 318 |
| Renter-occupied | 238 |
| Average household size of owner-occupied unit | 3.29 |
| Average household size of renter-occupied unit | 2.86 |
| Occupied housing units | 556 |
| Moved in 2017 or later | 19 |
| Moved in 2015 to 2016 | 94 |
| Moved in 2010 to 2014 | 157 |
| Moved in 2000 to 2009 | 142 |
| Moved in 1990 to 1999 | 100 |
| Moved in 1989 and earlier | 44 |
| Owner-occupied units | 318 |
| Less than $50,000 | 22 |
| $50,000 to $99,999 | 77 |
| $100,000 to $149,999 | 92 |
| $150,000 to $199,999 | 76 |
| $200,000 to $299,999 | 21 |
| $300,000 to $499,999 | 23 |
| $500,000 to $999,999 | 0 |
| $1,000,000 or more | 7 |
| Median (dollars) | 131,000 |
| Owner-occupied units | 318 |
| Housing units with a mortgage | 178 |
| Housing units without a mortgage | 140 |
| Occupied units paying rent | 223 |
| Less than $500 | 23 |
| $500 to $999 | 84 |
| $1,000 to $1,499 | 101 |
| $1,500 to $1,999 | 15 |
| $2,000 to $2,499 | 0 |
| $2,500 to $2,999 | 0 |
| $3,000 or more | 0 |
| Median (dollars) | 1,013 |
| No rent paid | 15 |
Data is based on 2018 Census
ZIP Codes for other locations
State for WINLOCK
Washington ZIP CodesOther cities in Washington