CEDAR FALLS, IA ZIP Code
| City | CEDAR FALLS |
| State | Iowa |
| ZIP Codes count | 2 (see all) |
| Post offices count | 1 (see all) |
| Total population | 41,202 (see all) |
ZIP Codes in CEDAR FALLS, Iowa
50613, 50614
This list contains only 5-digit ZIP codes. Use our zip code lookup by address feature to get the full 9-digit (ZIP+4) code.
List of CEDAR FALLS, IA ZIP Codes
| ZIP | TYPE | POPU |
|---|---|---|
| 50613 | STANDARD | 43,708 |
| 50614 | UNIQUE | – |
Post offices
CEDAR FALLS — Post Office™ 221 W 6TH ST CEDAR FALLS, IA 50613-9998 |
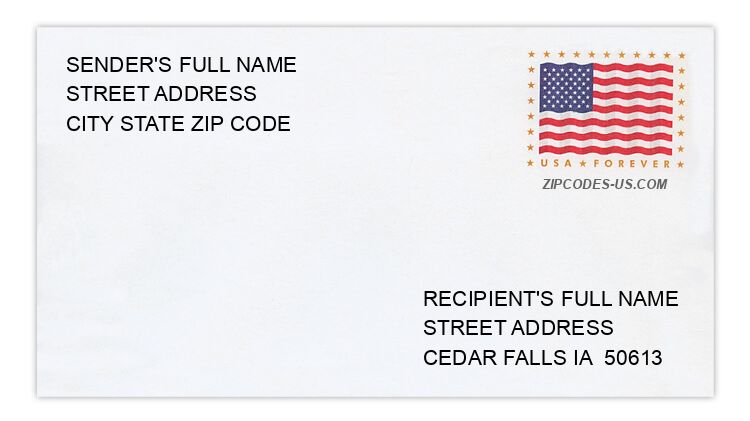
Envelope example
On the bottom center of the envelope, write the address you want your letter delivered to. Include the following on separate lines:
- Recipient's full name
- Full street address
- City, State, and ZIP Code
Using the same format, write the return address in the top left corner.
Using the full ZIP+4 Code when mailing via the USPS ensures the fastest, most accurate mailing possible. If you are not sure of the full 9-digit ZIP Code, use the 5-digit ZIP Code to avoid loss of letter or package.
The recipient address information is provided for your reference.
Address example
1837 ALDEN AVE
CEDAR FALLS IA 50613-4808
CEDAR FALLS IA 50613-4808
567 BARBARA DR
CEDAR FALLS IA 50613-2354
CEDAR FALLS IA 50613-2354
2615 COVEY CT
CEDAR FALLS IA 50613-4937
CEDAR FALLS IA 50613-4937
1893 DONALD DR
CEDAR FALLS IA 50613-7011
CEDAR FALLS IA 50613-7011
152 GILCHRIST ST
CEDAR FALLS IA 50614-0060
CEDAR FALLS IA 50614-0060
4170 MARYHILL DR
CEDAR FALLS IA 50613-5781
CEDAR FALLS IA 50613-5781
Map
Hover over the map to see the ZIP code
Census data for CEDAR FALLS, IA
Demographic and housing estimates in CEDAR FALLS, IA
| Total population | 41,202 |
| Male | 19,214 |
| Female | 21,988 |
| Total population | 41,202 |
| Under 5 years | 2,447 |
| 5 to 9 years | 1,953 |
| 10 to 14 years | 2,046 |
| 15 to 19 years | 4,374 |
| 20 to 24 years | 8,502 |
| 25 to 34 years | 5,353 |
| 35 to 44 years | 3,798 |
| 45 to 54 years | 3,104 |
| 55 to 59 years | 2,024 |
| 60 to 64 years | 1,956 |
| 65 to 74 years | 3,078 |
| 75 to 84 years | 1,583 |
| 85 years and over | 984 |
| Median age (years) | 26.9 |
| Under 18 years | 7,591 |
| 16 years and over | 34,391 |
| 18 years and over | 33,611 |
| 21 years and over | 27,758 |
| 62 years and over | 6,903 |
| 65 years and over | 5,645 |
| Total population | 41,202 |
| One race | 40,630 |
| White | 37,695 |
| Black or African American | 1,013 |
| American Indian and Alaska Native | 173 |
| Asian | 1,425 |
| Native Hawaiian and Other Pacific Islander | 71 |
| Some other race | 253 |
| Two or more races | 572 |
| Citizen, VOTING AGE 18 and over population | 32,747 |
| Male Citizen, VOTING AGE 18 and over population | 14,881 |
| Female Citizen, VOTING AGE 18 and over population | 17,866 |
Social characteristics in CEDAR FALLS, IA
| Total households | 15,144 |
| Family households (families) | 8,057 |
| Married-couple family | 6,732 |
| Male householder, no wife present, family | 423 |
| Female householder, no husband present, family | 902 |
| Nonfamily households | 7,087 |
| Average household size | 2.45 |
| Average family size | 3.03 |
Economic characteristics in CEDAR FALLS, IA
| Total households | 15,144 |
| Less than $10,000 | 1,062 |
| $10,000 to $14,999 | 619 |
| $15,000 to $24,999 | 1,414 |
| $25,000 to $34,999 | 1,535 |
| $35,000 to $49,999 | 1,874 |
| $50,000 to $74,999 | 2,600 |
| $75,000 to $99,999 | 2,014 |
| $100,000 to $149,999 | 2,398 |
| $150,000 to $199,999 | 757 |
| $200,000 or more | 871 |
| Median household income (dollars) | 60,068 |
Housing characteristics in CEDAR FALLS, IA
| Total housing units | 16,338 |
| Occupied housing units | 15,144 |
| Vacant housing units | 1,194 |
| Total housing units | 16,338 |
| 1-unit, detached | 9,819 |
| 1-unit, attached | 908 |
| 2 units | 576 |
| 3 or 4 units | 991 |
| 5 to 9 units | 681 |
| 10 to 19 units | 1,313 |
| 20 or more units | 1,390 |
| Mobile home | 660 |
| Boat, RV, van, etc. | 0 |
| Total housing units | 16,338 |
| Built 2014 or later | 280 |
| Built 2010 to 2013 | 809 |
| Built 2000 to 2009 | 2,123 |
| Built 1990 to 1999 | 1,863 |
| Built 1980 to 1989 | 1,221 |
| Built 1970 to 1979 | 2,525 |
| Built 1960 to 1969 | 2,190 |
| Built 1950 to 1959 | 2,720 |
| Built 1940 to 1949 | 771 |
| Built 1939 or earlier | 1,836 |
| Total housing units | 16,338 |
| 1 room | 259 |
| 2 rooms | 465 |
| 3 rooms | 1,493 |
| 4 rooms | 2,538 |
| 5 rooms | 2,778 |
| 6 rooms | 2,539 |
| 7 rooms | 1,816 |
| 8 rooms | 1,779 |
| 9 rooms or more | 2,671 |
| Median rooms | 5.8 |
| Total housing units | 16,338 |
| No bedroom | 264 |
| 1 bedroom | 1,841 |
| 2 bedrooms | 4,360 |
| 3 bedrooms | 5,192 |
| 4 bedrooms | 3,634 |
| 5 or more bedrooms | 1,047 |
| Occupied housing units | 15,144 |
| Owner-occupied | 9,664 |
| Renter-occupied | 5,480 |
| Average household size of owner-occupied unit | 2.48 |
| Average household size of renter-occupied unit | 2.40 |
| Occupied housing units | 15,144 |
| Moved in 2017 or later | 1,346 |
| Moved in 2015 to 2016 | 2,644 |
| Moved in 2010 to 2014 | 4,726 |
| Moved in 2000 to 2009 | 3,144 |
| Moved in 1990 to 1999 | 1,359 |
| Moved in 1989 and earlier | 1,925 |
| Owner-occupied units | 9,664 |
| Less than $50,000 | 551 |
| $50,000 to $99,999 | 526 |
| $100,000 to $149,999 | 1,932 |
| $150,000 to $199,999 | 2,497 |
| $200,000 to $299,999 | 2,587 |
| $300,000 to $499,999 | 1,357 |
| $500,000 to $999,999 | 201 |
| $1,000,000 or more | 13 |
| Median (dollars) | 181,900 |
| Owner-occupied units | 9,664 |
| Housing units with a mortgage | 5,965 |
| Housing units without a mortgage | 3,699 |
| Occupied units paying rent | 5,413 |
| Less than $500 | 682 |
| $500 to $999 | 2,752 |
| $1,000 to $1,499 | 1,211 |
| $1,500 to $1,999 | 647 |
| $2,000 to $2,499 | 111 |
| $2,500 to $2,999 | 0 |
| $3,000 or more | 10 |
| Median (dollars) | 844 |
| No rent paid | 67 |
Data is based on 2018 Census
ZIP Codes for other locations
State for CEDAR FALLS
Iowa ZIP CodesOther cities in Iowa