CLARION, IA ZIP Code
| City | CLARION |
| State | Iowa |
| ZIP Codes count | 2 (see all) |
| Post offices count | 1 (see all) |
| Total population | 2,772 (see all) |
ZIP Codes in CLARION, Iowa
50525, 50526
This list contains only 5-digit ZIP codes. Use our zip code lookup by address feature to get the full 9-digit (ZIP+4) code.
List of CLARION, IA ZIP Codes
| ZIP | TYPE | POPU |
|---|---|---|
| 50525 | STANDARD | 3,452 |
| 50526 | UNIQUE | – |
Post offices
CLARION — Post Office™ 115 1ST ST NE STE 1 CLARION, IA 50525-9998 |
Envelope example
On the bottom center of the envelope, write the address you want your letter delivered to. Include the following on separate lines:
- Recipient's full name
- Full street address
- City, State, and ZIP Code
Using the same format, write the return address in the top left corner.
Using the full ZIP+4 Code when mailing via the USPS ensures the fastest, most accurate mailing possible. If you are not sure of the full 9-digit ZIP Code, use the 5-digit ZIP Code to avoid loss of letter or package.
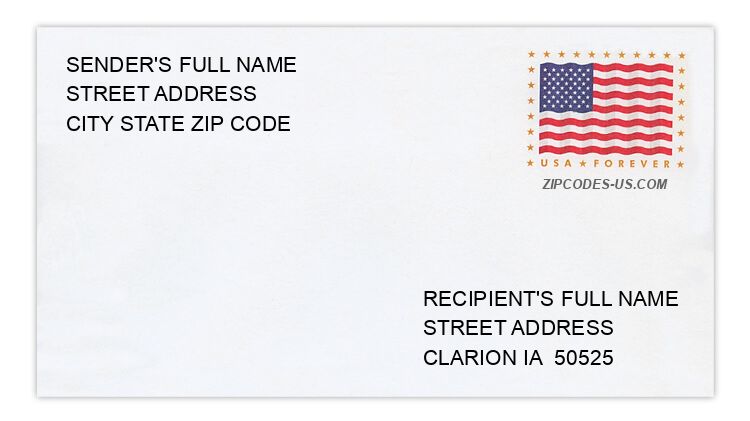
The recipient address information is provided for your reference.
Address example
118 13TH AVE SW
CLARION IA 50525-2004
CLARION IA 50525-2004
1518 160TH ST
CLARION IA 50525-7517
CLARION IA 50525-7517
2340 310TH ST
CLARION IA 50525-7645
CLARION IA 50525-7645
356 3RD AVE NW
CLARION IA 50525-1021
CLARION IA 50525-1021
1874 CORNELIA DR
CLARION IA 50525-7562
CLARION IA 50525-7562
1659 IDA AVE
CLARION IA 50525-7574
CLARION IA 50525-7574
Map
Hover over the map to see the ZIP code
Census data for CLARION, IA
Demographic and housing estimates in CLARION, IA
| Total population | 2,772 |
| Male | 1,343 |
| Female | 1,429 |
| Total population | 2,772 |
| Under 5 years | 200 |
| 5 to 9 years | 127 |
| 10 to 14 years | 191 |
| 15 to 19 years | 157 |
| 20 to 24 years | 187 |
| 25 to 34 years | 274 |
| 35 to 44 years | 349 |
| 45 to 54 years | 263 |
| 55 to 59 years | 156 |
| 60 to 64 years | 221 |
| 65 to 74 years | 246 |
| 75 to 84 years | 218 |
| 85 years and over | 183 |
| Median age (years) | 42.1 |
| Under 18 years | 645 |
| 16 years and over | 2,225 |
| 18 years and over | 2,127 |
| 21 years and over | 2,061 |
| 62 years and over | 749 |
| 65 years and over | 647 |
| Total population | 2,772 |
| One race | 2,697 |
| White | 2,321 |
| Black or African American | 4 |
| American Indian and Alaska Native | 0 |
| Asian | 10 |
| Native Hawaiian and Other Pacific Islander | 0 |
| Some other race | 362 |
| Two or more races | 75 |
| Citizen, VOTING AGE 18 and over population | 1,965 |
| Male Citizen, VOTING AGE 18 and over population | 929 |
| Female Citizen, VOTING AGE 18 and over population | 1,036 |
Social characteristics in CLARION, IA
| Total households | 1,218 |
| Family households (families) | 729 |
| Married-couple family | 522 |
| Male householder, no wife present, family | 58 |
| Female householder, no husband present, family | 149 |
| Nonfamily households | 489 |
| Average household size | 2.17 |
| Average family size | 2.76 |
Economic characteristics in CLARION, IA
| Total households | 1,218 |
| Less than $10,000 | 81 |
| $10,000 to $14,999 | 88 |
| $15,000 to $24,999 | 164 |
| $25,000 to $34,999 | 134 |
| $35,000 to $49,999 | 193 |
| $50,000 to $74,999 | 261 |
| $75,000 to $99,999 | 123 |
| $100,000 to $149,999 | 116 |
| $150,000 to $199,999 | 39 |
| $200,000 or more | 19 |
| Median household income (dollars) | 43,472 |
Housing characteristics in CLARION, IA
| Total housing units | 1,373 |
| Occupied housing units | 1,218 |
| Vacant housing units | 155 |
| Total housing units | 1,373 |
| 1-unit, detached | 1,127 |
| 1-unit, attached | 17 |
| 2 units | 27 |
| 3 or 4 units | 84 |
| 5 to 9 units | 30 |
| 10 to 19 units | 19 |
| 20 or more units | 64 |
| Mobile home | 5 |
| Boat, RV, van, etc. | 0 |
| Total housing units | 1,373 |
| Built 2014 or later | 0 |
| Built 2010 to 2013 | 5 |
| Built 2000 to 2009 | 42 |
| Built 1990 to 1999 | 86 |
| Built 1980 to 1989 | 77 |
| Built 1970 to 1979 | 180 |
| Built 1960 to 1969 | 111 |
| Built 1950 to 1959 | 230 |
| Built 1940 to 1949 | 56 |
| Built 1939 or earlier | 586 |
| Total housing units | 1,373 |
| 1 room | 22 |
| 2 rooms | 9 |
| 3 rooms | 91 |
| 4 rooms | 278 |
| 5 rooms | 197 |
| 6 rooms | 314 |
| 7 rooms | 218 |
| 8 rooms | 65 |
| 9 rooms or more | 179 |
| Median rooms | 5.8 |
| Total housing units | 1,373 |
| No bedroom | 22 |
| 1 bedroom | 138 |
| 2 bedrooms | 400 |
| 3 bedrooms | 549 |
| 4 bedrooms | 202 |
| 5 or more bedrooms | 62 |
| Occupied housing units | 1,218 |
| Owner-occupied | 815 |
| Renter-occupied | 403 |
| Average household size of owner-occupied unit | 2.29 |
| Average household size of renter-occupied unit | 1.93 |
| Occupied housing units | 1,218 |
| Moved in 2017 or later | 55 |
| Moved in 2015 to 2016 | 158 |
| Moved in 2010 to 2014 | 356 |
| Moved in 2000 to 2009 | 264 |
| Moved in 1990 to 1999 | 180 |
| Moved in 1989 and earlier | 205 |
| Owner-occupied units | 815 |
| Less than $50,000 | 170 |
| $50,000 to $99,999 | 314 |
| $100,000 to $149,999 | 122 |
| $150,000 to $199,999 | 168 |
| $200,000 to $299,999 | 36 |
| $300,000 to $499,999 | 5 |
| $500,000 to $999,999 | 0 |
| $1,000,000 or more | 0 |
| Median (dollars) | 82,800 |
| Owner-occupied units | 815 |
| Housing units with a mortgage | 442 |
| Housing units without a mortgage | 373 |
| Occupied units paying rent | 389 |
| Less than $500 | 101 |
| $500 to $999 | 224 |
| $1,000 to $1,499 | 41 |
| $1,500 to $1,999 | 10 |
| $2,000 to $2,499 | 4 |
| $2,500 to $2,999 | 5 |
| $3,000 or more | 4 |
| Median (dollars) | 678 |
| No rent paid | 14 |
Data is based on 2018 Census
ZIP Codes for other locations
State for CLARION
Iowa ZIP CodesOther cities in Iowa