CLIVE, IA ZIP Code
| City | CLIVE |
| State | Iowa |
| ZIP Codes count | 2 (see all) |
| Post offices count | 2 (see all) |
| Total population | 17,195 (see all) |
ZIP Codes in CLIVE, Iowa
50324, 50325
This list contains only 5-digit ZIP codes. Use our zip code lookup by address feature to get the full 9-digit (ZIP+4) code.
List of CLIVE, IA ZIP Codes
| ZIP | TYPE | POPU |
|---|---|---|
| 50324 | STANDARD | 5,208 |
| 50325 | STANDARD | 18,323 |
Post offices
UNIVERSITY STATION — Post Office™ 2323 FOREST AVE DES MOINES, IA 50311-3198 |
WEST SUBURBAN — Post Office™ 2135 NW 108TH ST CLIVE, IA 50325-3704 |
Envelope example
On the bottom center of the envelope, write the address you want your letter delivered to. Include the following on separate lines:
- Recipient's full name
- Full street address
- City, State, and ZIP Code
Using the same format, write the return address in the top left corner.
Using the full ZIP+4 Code when mailing via the USPS ensures the fastest, most accurate mailing possible. If you are not sure of the full 9-digit ZIP Code, use the 5-digit ZIP Code to avoid loss of letter or package.
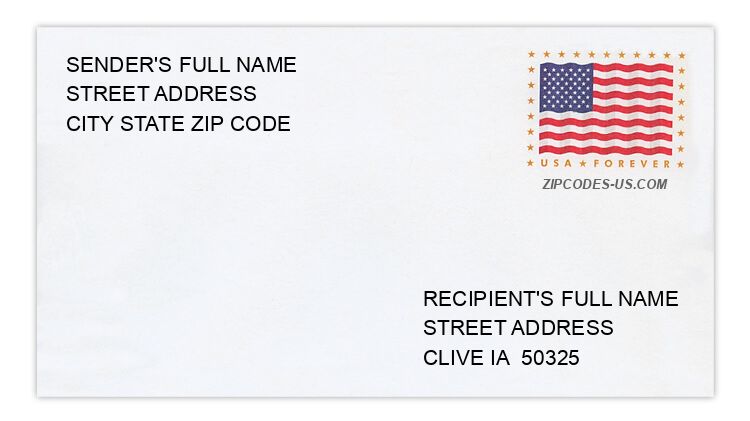
The recipient address information is provided for your reference.
Address example
1516 HICKORY LAKE CT
CLIVE IA 50325-8160
CLIVE IA 50325-8160
3512 HORTON CIR
CLIVE IA 50325-2603
CLIVE IA 50325-2603
10357 MARGUERITE LN
CLIVE IA 50325-6530
CLIVE IA 50325-6530
1856 NW 151ST CT
CLIVE IA 50325-7850
CLIVE IA 50325-7850
4309 NW 166TH CIR
CLIVE IA 50325-2518
CLIVE IA 50325-2518
1835 NW 87TH PL
CLIVE IA 50325-5471
CLIVE IA 50325-5471
Map
Hover over the map to see the ZIP code
Census data for CLIVE, IA
Demographic and housing estimates in CLIVE, IA
| Total population | 17,195 |
| Male | 8,504 |
| Female | 8,691 |
| Total population | 17,195 |
| Under 5 years | 1,147 |
| 5 to 9 years | 1,487 |
| 10 to 14 years | 1,364 |
| 15 to 19 years | 968 |
| 20 to 24 years | 575 |
| 25 to 34 years | 1,790 |
| 35 to 44 years | 2,516 |
| 45 to 54 years | 2,509 |
| 55 to 59 years | 1,352 |
| 60 to 64 years | 984 |
| 65 to 74 years | 1,487 |
| 75 to 84 years | 667 |
| 85 years and over | 349 |
| Median age (years) | 40.0 |
| Under 18 years | 4,706 |
| 16 years and over | 12,951 |
| 18 years and over | 12,489 |
| 21 years and over | 12,131 |
| 62 years and over | 3,077 |
| 65 years and over | 2,503 |
| Total population | 17,195 |
| One race | 16,773 |
| White | 14,991 |
| Black or African American | 354 |
| American Indian and Alaska Native | 52 |
| Asian | 960 |
| Native Hawaiian and Other Pacific Islander | 0 |
| Some other race | 416 |
| Two or more races | 422 |
| Citizen, VOTING AGE 18 and over population | 11,815 |
| Male Citizen, VOTING AGE 18 and over population | 5,805 |
| Female Citizen, VOTING AGE 18 and over population | 6,010 |
Social characteristics in CLIVE, IA
| Total households | 6,618 |
| Family households (families) | 4,994 |
| Married-couple family | 4,299 |
| Male householder, no wife present, family | 222 |
| Female householder, no husband present, family | 473 |
| Nonfamily households | 1,624 |
| Average household size | 2.59 |
| Average family size | 3.02 |
Economic characteristics in CLIVE, IA
| Total households | 6,618 |
| Less than $10,000 | 122 |
| $10,000 to $14,999 | 88 |
| $15,000 to $24,999 | 373 |
| $25,000 to $34,999 | 384 |
| $35,000 to $49,999 | 521 |
| $50,000 to $74,999 | 812 |
| $75,000 to $99,999 | 934 |
| $100,000 to $149,999 | 1,533 |
| $150,000 to $199,999 | 739 |
| $200,000 or more | 1,112 |
| Median household income (dollars) | 101,616 |
Housing characteristics in CLIVE, IA
| Total housing units | 6,931 |
| Occupied housing units | 6,618 |
| Vacant housing units | 313 |
| Total housing units | 6,931 |
| 1-unit, detached | 4,838 |
| 1-unit, attached | 506 |
| 2 units | 121 |
| 3 or 4 units | 31 |
| 5 to 9 units | 267 |
| 10 to 19 units | 602 |
| 20 or more units | 563 |
| Mobile home | 3 |
| Boat, RV, van, etc. | 0 |
| Total housing units | 6,931 |
| Built 2014 or later | 133 |
| Built 2010 to 2013 | 538 |
| Built 2000 to 2009 | 1,119 |
| Built 1990 to 1999 | 2,104 |
| Built 1980 to 1989 | 883 |
| Built 1970 to 1979 | 1,272 |
| Built 1960 to 1969 | 614 |
| Built 1950 to 1959 | 143 |
| Built 1940 to 1949 | 50 |
| Built 1939 or earlier | 75 |
| Total housing units | 6,931 |
| 1 room | 9 |
| 2 rooms | 179 |
| 3 rooms | 311 |
| 4 rooms | 890 |
| 5 rooms | 544 |
| 6 rooms | 893 |
| 7 rooms | 980 |
| 8 rooms | 806 |
| 9 rooms or more | 2,319 |
| Median rooms | 7.2 |
| Total housing units | 6,931 |
| No bedroom | 9 |
| 1 bedroom | 424 |
| 2 bedrooms | 1,397 |
| 3 bedrooms | 1,877 |
| 4 bedrooms | 2,483 |
| 5 or more bedrooms | 741 |
| Occupied housing units | 6,618 |
| Owner-occupied | 5,278 |
| Renter-occupied | 1,340 |
| Average household size of owner-occupied unit | 2.72 |
| Average household size of renter-occupied unit | 2.10 |
| Occupied housing units | 6,618 |
| Moved in 2017 or later | 188 |
| Moved in 2015 to 2016 | 880 |
| Moved in 2010 to 2014 | 2,071 |
| Moved in 2000 to 2009 | 1,982 |
| Moved in 1990 to 1999 | 1,162 |
| Moved in 1989 and earlier | 335 |
| Owner-occupied units | 5,278 |
| Less than $50,000 | 60 |
| $50,000 to $99,999 | 169 |
| $100,000 to $149,999 | 213 |
| $150,000 to $199,999 | 695 |
| $200,000 to $299,999 | 2,026 |
| $300,000 to $499,999 | 1,557 |
| $500,000 to $999,999 | 549 |
| $1,000,000 or more | 9 |
| Median (dollars) | 252,500 |
| Owner-occupied units | 5,278 |
| Housing units with a mortgage | 3,847 |
| Housing units without a mortgage | 1,431 |
| Occupied units paying rent | 1,281 |
| Less than $500 | 0 |
| $500 to $999 | 751 |
| $1,000 to $1,499 | 244 |
| $1,500 to $1,999 | 108 |
| $2,000 to $2,499 | 34 |
| $2,500 to $2,999 | 0 |
| $3,000 or more | 144 |
| Median (dollars) | 893 |
| No rent paid | 59 |
Data is based on 2018 Census
ZIP Codes for other locations
State for CLIVE
Iowa ZIP CodesOther cities in Iowa