IOWA FALLS, IA ZIP Code
| City | IOWA FALLS |
| State | Iowa |
| ZIP Codes count | 1 (see all) |
| Post offices count | 1 (see all) |
| Total population | 5,124 (see all) |
ZIP Code in IOWA FALLS, Iowa
50126
This list contains only 5-digit ZIP codes. Use our zip code lookup by address feature to get the full 9-digit (ZIP+4) code.
List of IOWA FALLS, IA ZIP Codes
| ZIP | TYPE | POPU |
|---|---|---|
| 50126 | STANDARD | 6,507 |
Post offices
IOWA FALLS — Post Office™ 401 MAIN ST IOWA FALLS, IA 50126-2203 |
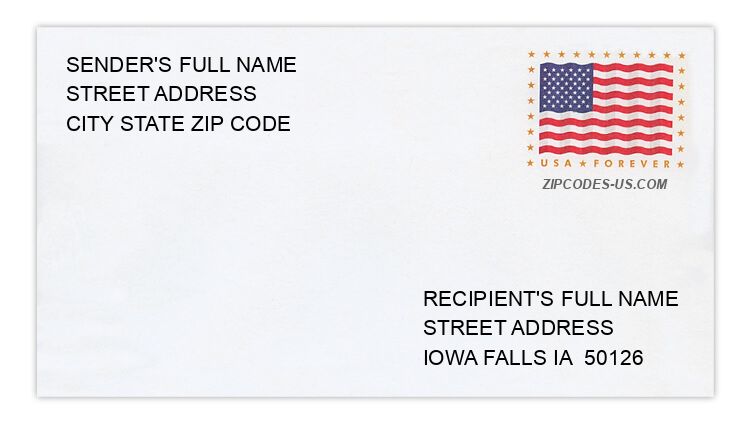
Envelope example
On the bottom center of the envelope, write the address you want your letter delivered to. Include the following on separate lines:
- Recipient's full name
- Full street address
- City, State, and ZIP Code
Using the same format, write the return address in the top left corner.
Using the full ZIP+4 Code when mailing via the USPS ensures the fastest, most accurate mailing possible. If you are not sure of the full 9-digit ZIP Code, use the 5-digit ZIP Code to avoid loss of letter or package.
The recipient address information is provided for your reference.
Address example
256 SLAYTON AVE
IOWA FALLS IA 50126-1643
IOWA FALLS IA 50126-1643
1174 ELIZABETH ST
IOWA FALLS IA 50126-1306
IOWA FALLS IA 50126-1306
416 BLISS BLVD
IOWA FALLS IA 50126-2702
IOWA FALLS IA 50126-2702
179 SLAYTON AVE
IOWA FALLS IA 50126-1601
IOWA FALLS IA 50126-1601
22347 115TH ST
IOWA FALLS IA 50126-8861
IOWA FALLS IA 50126-8861
23716 HIGHWAY D15
IOWA FALLS IA 50126-8741
IOWA FALLS IA 50126-8741
Map
Hover over the map to see the ZIP code
Census data for IOWA FALLS, IA
Demographic and housing estimates in IOWA FALLS, IA
| Total population | 5,124 |
| Male | 2,534 |
| Female | 2,590 |
| Total population | 5,124 |
| Under 5 years | 224 |
| 5 to 9 years | 256 |
| 10 to 14 years | 278 |
| 15 to 19 years | 536 |
| 20 to 24 years | 300 |
| 25 to 34 years | 643 |
| 35 to 44 years | 412 |
| 45 to 54 years | 530 |
| 55 to 59 years | 317 |
| 60 to 64 years | 434 |
| 65 to 74 years | 592 |
| 75 to 84 years | 373 |
| 85 years and over | 229 |
| Median age (years) | 44.2 |
| Under 18 years | 952 |
| 16 years and over | 4,302 |
| 18 years and over | 4,172 |
| 21 years and over | 3,771 |
| 62 years and over | 1,465 |
| 65 years and over | 1,194 |
| Total population | 5,124 |
| One race | 5,043 |
| White | 4,899 |
| Black or African American | 102 |
| American Indian and Alaska Native | 32 |
| Asian | 0 |
| Native Hawaiian and Other Pacific Islander | 0 |
| Some other race | 10 |
| Two or more races | 81 |
| Citizen, VOTING AGE 18 and over population | 4,086 |
| Male Citizen, VOTING AGE 18 and over population | 1,916 |
| Female Citizen, VOTING AGE 18 and over population | 2,170 |
Social characteristics in IOWA FALLS, IA
| Total households | 2,203 |
| Family households (families) | 1,206 |
| Married-couple family | 967 |
| Male householder, no wife present, family | 72 |
| Female householder, no husband present, family | 167 |
| Nonfamily households | 997 |
| Average household size | 2.12 |
| Average family size | 2.89 |
Economic characteristics in IOWA FALLS, IA
| Total households | 2,203 |
| Less than $10,000 | 119 |
| $10,000 to $14,999 | 145 |
| $15,000 to $24,999 | 340 |
| $25,000 to $34,999 | 206 |
| $35,000 to $49,999 | 303 |
| $50,000 to $74,999 | 477 |
| $75,000 to $99,999 | 295 |
| $100,000 to $149,999 | 236 |
| $150,000 to $199,999 | 36 |
| $200,000 or more | 46 |
| Median household income (dollars) | 49,521 |
Housing characteristics in IOWA FALLS, IA
| Total housing units | 2,496 |
| Occupied housing units | 2,203 |
| Vacant housing units | 293 |
| Total housing units | 2,496 |
| 1-unit, detached | 1,875 |
| 1-unit, attached | 30 |
| 2 units | 153 |
| 3 or 4 units | 116 |
| 5 to 9 units | 183 |
| 10 to 19 units | 14 |
| 20 or more units | 114 |
| Mobile home | 11 |
| Boat, RV, van, etc. | 0 |
| Total housing units | 2,496 |
| Built 2014 or later | 0 |
| Built 2010 to 2013 | 0 |
| Built 2000 to 2009 | 26 |
| Built 1990 to 1999 | 111 |
| Built 1980 to 1989 | 192 |
| Built 1970 to 1979 | 245 |
| Built 1960 to 1969 | 290 |
| Built 1950 to 1959 | 425 |
| Built 1940 to 1949 | 164 |
| Built 1939 or earlier | 1,043 |
| Total housing units | 2,496 |
| 1 room | 22 |
| 2 rooms | 69 |
| 3 rooms | 235 |
| 4 rooms | 330 |
| 5 rooms | 434 |
| 6 rooms | 522 |
| 7 rooms | 253 |
| 8 rooms | 266 |
| 9 rooms or more | 365 |
| Median rooms | 5.8 |
| Total housing units | 2,496 |
| No bedroom | 22 |
| 1 bedroom | 407 |
| 2 bedrooms | 714 |
| 3 bedrooms | 1,050 |
| 4 bedrooms | 244 |
| 5 or more bedrooms | 59 |
| Occupied housing units | 2,203 |
| Owner-occupied | 1,558 |
| Renter-occupied | 645 |
| Average household size of owner-occupied unit | 2.07 |
| Average household size of renter-occupied unit | 2.25 |
| Occupied housing units | 2,203 |
| Moved in 2017 or later | 75 |
| Moved in 2015 to 2016 | 287 |
| Moved in 2010 to 2014 | 687 |
| Moved in 2000 to 2009 | 488 |
| Moved in 1990 to 1999 | 291 |
| Moved in 1989 and earlier | 375 |
| Owner-occupied units | 1,558 |
| Less than $50,000 | 303 |
| $50,000 to $99,999 | 616 |
| $100,000 to $149,999 | 305 |
| $150,000 to $199,999 | 202 |
| $200,000 to $299,999 | 109 |
| $300,000 to $499,999 | 23 |
| $500,000 to $999,999 | 0 |
| $1,000,000 or more | 0 |
| Median (dollars) | 87,400 |
| Owner-occupied units | 1,558 |
| Housing units with a mortgage | 940 |
| Housing units without a mortgage | 618 |
| Occupied units paying rent | 631 |
| Less than $500 | 186 |
| $500 to $999 | 303 |
| $1,000 to $1,499 | 102 |
| $1,500 to $1,999 | 11 |
| $2,000 to $2,499 | 13 |
| $2,500 to $2,999 | 8 |
| $3,000 or more | 8 |
| Median (dollars) | 642 |
| No rent paid | 14 |
Data is based on 2018 Census
ZIP Codes for other locations
State for IOWA FALLS
Iowa ZIP CodesOther cities in Iowa