LE MARS, IA ZIP Code
| City | LE MARS |
| State | Iowa |
| ZIP Codes count | 1 (see all) |
| Post offices count | 1 (see all) |
| Total population | 9,894 (see all) |
ZIP Code in LE MARS, Iowa
51031
This list contains only 5-digit ZIP codes. Use our zip code lookup by address feature to get the full 9-digit (ZIP+4) code.
List of LE MARS, IA ZIP Codes
| ZIP | TYPE | POPU |
|---|---|---|
| 51031 | STANDARD | 12,418 |
Post offices
LE MARS — Post Office™ 230 1ST ST NW LE MARS, IA 51031-9998 |
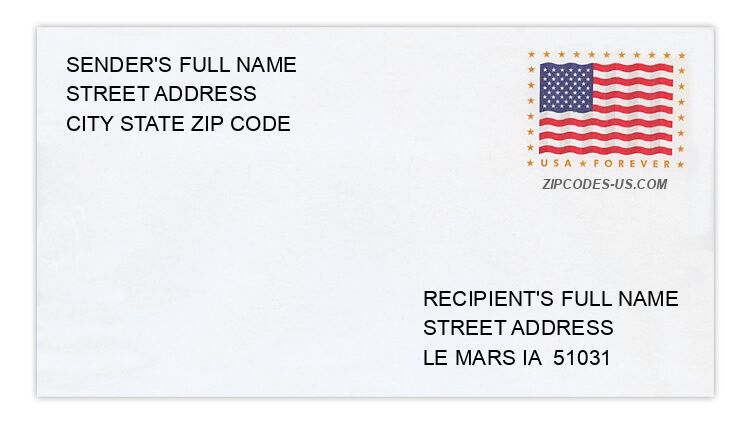
Envelope example
On the bottom center of the envelope, write the address you want your letter delivered to. Include the following on separate lines:
- Recipient's full name
- Full street address
- City, State, and ZIP Code
Using the same format, write the return address in the top left corner.
Using the full ZIP+4 Code when mailing via the USPS ensures the fastest, most accurate mailing possible. If you are not sure of the full 9-digit ZIP Code, use the 5-digit ZIP Code to avoid loss of letter or package.
The recipient address information is provided for your reference.
Address example
170 17TH ST SW
LE MARS IA 51031-5200
LE MARS IA 51031-5200
1227 1ST AVE SW
LE MARS IA 51031-2701
LE MARS IA 51031-2701
115 2ND ST NE
LE MARS IA 51031-3209
LE MARS IA 51031-3209
1666 4TH AVE SW
LE MARS IA 51031-8202
LE MARS IA 51031-8202
26585 LYNX AVE
LE MARS IA 51031-8249
LE MARS IA 51031-8249
14912 MEADOWLARK AVE
LE MARS IA 51031-8890
LE MARS IA 51031-8890
Map
Hover over the map to see the ZIP code
Census data for LE MARS, IA
Demographic and housing estimates in LE MARS, IA
| Total population | 9,894 |
| Male | 4,799 |
| Female | 5,095 |
| Total population | 9,894 |
| Under 5 years | 739 |
| 5 to 9 years | 800 |
| 10 to 14 years | 478 |
| 15 to 19 years | 632 |
| 20 to 24 years | 677 |
| 25 to 34 years | 1,021 |
| 35 to 44 years | 1,241 |
| 45 to 54 years | 989 |
| 55 to 59 years | 843 |
| 60 to 64 years | 662 |
| 65 to 74 years | 820 |
| 75 to 84 years | 633 |
| 85 years and over | 359 |
| Median age (years) | 38.6 |
| Under 18 years | 2,473 |
| 16 years and over | 7,721 |
| 18 years and over | 7,421 |
| 21 years and over | 7,189 |
| 62 years and over | 2,213 |
| 65 years and over | 1,812 |
| Total population | 9,894 |
| One race | 9,735 |
| White | 9,247 |
| Black or African American | 52 |
| American Indian and Alaska Native | 61 |
| Asian | 59 |
| Native Hawaiian and Other Pacific Islander | 0 |
| Some other race | 316 |
| Two or more races | 159 |
| Citizen, VOTING AGE 18 and over population | 7,224 |
| Male Citizen, VOTING AGE 18 and over population | 3,362 |
| Female Citizen, VOTING AGE 18 and over population | 3,862 |
Social characteristics in LE MARS, IA
| Total households | 4,142 |
| Family households (families) | 2,779 |
| Married-couple family | 2,063 |
| Male householder, no wife present, family | 239 |
| Female householder, no husband present, family | 477 |
| Nonfamily households | 1,363 |
| Average household size | 2.33 |
| Average family size | 2.77 |
Economic characteristics in LE MARS, IA
| Total households | 4,142 |
| Less than $10,000 | 174 |
| $10,000 to $14,999 | 175 |
| $15,000 to $24,999 | 434 |
| $25,000 to $34,999 | 322 |
| $35,000 to $49,999 | 567 |
| $50,000 to $74,999 | 726 |
| $75,000 to $99,999 | 711 |
| $100,000 to $149,999 | 777 |
| $150,000 to $199,999 | 182 |
| $200,000 or more | 74 |
| Median household income (dollars) | 60,632 |
Housing characteristics in LE MARS, IA
| Total housing units | 4,390 |
| Occupied housing units | 4,142 |
| Vacant housing units | 248 |
| Total housing units | 4,390 |
| 1-unit, detached | 3,345 |
| 1-unit, attached | 158 |
| 2 units | 182 |
| 3 or 4 units | 83 |
| 5 to 9 units | 120 |
| 10 to 19 units | 116 |
| 20 or more units | 158 |
| Mobile home | 228 |
| Boat, RV, van, etc. | 0 |
| Total housing units | 4,390 |
| Built 2014 or later | 74 |
| Built 2010 to 2013 | 25 |
| Built 2000 to 2009 | 430 |
| Built 1990 to 1999 | 426 |
| Built 1980 to 1989 | 607 |
| Built 1970 to 1979 | 603 |
| Built 1960 to 1969 | 615 |
| Built 1950 to 1959 | 365 |
| Built 1940 to 1949 | 149 |
| Built 1939 or earlier | 1,096 |
| Total housing units | 4,390 |
| 1 room | 52 |
| 2 rooms | 44 |
| 3 rooms | 299 |
| 4 rooms | 621 |
| 5 rooms | 475 |
| 6 rooms | 716 |
| 7 rooms | 554 |
| 8 rooms | 616 |
| 9 rooms or more | 1,013 |
| Median rooms | 6.5 |
| Total housing units | 4,390 |
| No bedroom | 52 |
| 1 bedroom | 327 |
| 2 bedrooms | 1,108 |
| 3 bedrooms | 1,775 |
| 4 bedrooms | 870 |
| 5 or more bedrooms | 258 |
| Occupied housing units | 4,142 |
| Owner-occupied | 3,112 |
| Renter-occupied | 1,030 |
| Average household size of owner-occupied unit | 2.40 |
| Average household size of renter-occupied unit | 2.14 |
| Occupied housing units | 4,142 |
| Moved in 2017 or later | 206 |
| Moved in 2015 to 2016 | 386 |
| Moved in 2010 to 2014 | 1,137 |
| Moved in 2000 to 2009 | 1,214 |
| Moved in 1990 to 1999 | 524 |
| Moved in 1989 and earlier | 675 |
| Owner-occupied units | 3,112 |
| Less than $50,000 | 227 |
| $50,000 to $99,999 | 377 |
| $100,000 to $149,999 | 904 |
| $150,000 to $199,999 | 741 |
| $200,000 to $299,999 | 518 |
| $300,000 to $499,999 | 287 |
| $500,000 to $999,999 | 58 |
| $1,000,000 or more | 0 |
| Median (dollars) | 152,400 |
| Owner-occupied units | 3,112 |
| Housing units with a mortgage | 1,671 |
| Housing units without a mortgage | 1,441 |
| Occupied units paying rent | 926 |
| Less than $500 | 259 |
| $500 to $999 | 543 |
| $1,000 to $1,499 | 124 |
| $1,500 to $1,999 | 0 |
| $2,000 to $2,499 | 0 |
| $2,500 to $2,999 | 0 |
| $3,000 or more | 0 |
| Median (dollars) | 636 |
| No rent paid | 104 |
Data is based on 2018 Census
ZIP Codes for other locations
State for LE MARS
Iowa ZIP CodesOther cities in Iowa