TIFFIN, IA ZIP Code
| City | TIFFIN |
| State | Iowa |
| ZIP Codes count | 1 (see all) |
| Post offices count | 1 (see all) |
| Total population | 3,008 (see all) |
ZIP Code in TIFFIN, Iowa
52340
This list contains only 5-digit ZIP codes. Use our zip code lookup by address feature to get the full 9-digit (ZIP+4) code.
List of TIFFIN, IA ZIP Codes
| ZIP | TYPE | POPU |
|---|---|---|
| 52340 | STANDARD | 4,695 |
Post offices
TIFFIN — Post Office™ 484 STATE ST TIFFIN, IA 52340-4402 |
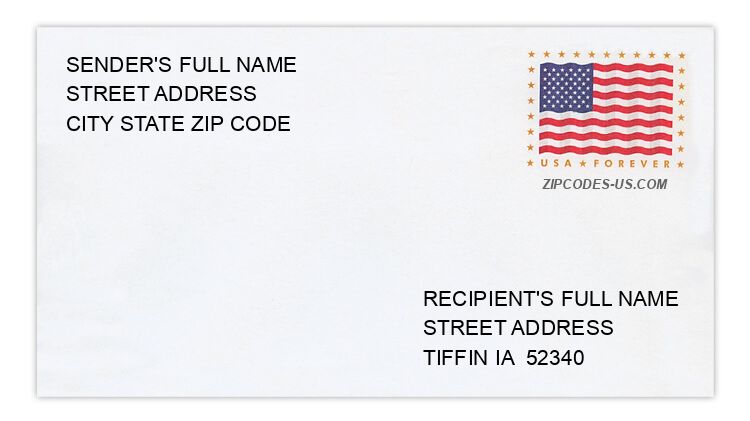
Envelope example
On the bottom center of the envelope, write the address you want your letter delivered to. Include the following on separate lines:
- Recipient's full name
- Full street address
- City, State, and ZIP Code
Using the same format, write the return address in the top left corner.
Using the full ZIP+4 Code when mailing via the USPS ensures the fastest, most accurate mailing possible. If you are not sure of the full 9-digit ZIP Code, use the 5-digit ZIP Code to avoid loss of letter or package.
The recipient address information is provided for your reference.
Address example
486 BAINBERRY ST
TIFFIN IA 52340-4745
TIFFIN IA 52340-4745
199 EDELWEISS CIR
TIFFIN IA 52340-4771
TIFFIN IA 52340-4771
1663 GREEN OAK PASS
TIFFIN IA 52340-9100
TIFFIN IA 52340-9100
2892 JAMES AVE NW
TIFFIN IA 52340-9392
TIFFIN IA 52340-9392
304 ORIOLE CT
TIFFIN IA 52340-9340
TIFFIN IA 52340-9340
370 W MARENGO RD
TIFFIN IA 52340-9307
TIFFIN IA 52340-9307
Map
Hover over the map to see the ZIP code
Census data for TIFFIN, IA
Demographic and housing estimates in TIFFIN, IA
| Total population | 3,008 |
| Male | 1,474 |
| Female | 1,534 |
| Total population | 3,008 |
| Under 5 years | 309 |
| 5 to 9 years | 196 |
| 10 to 14 years | 189 |
| 15 to 19 years | 101 |
| 20 to 24 years | 255 |
| 25 to 34 years | 570 |
| 35 to 44 years | 501 |
| 45 to 54 years | 315 |
| 55 to 59 years | 138 |
| 60 to 64 years | 130 |
| 65 to 74 years | 157 |
| 75 to 84 years | 79 |
| 85 years and over | 68 |
| Median age (years) | 32.4 |
| Under 18 years | 760 |
| 16 years and over | 2,265 |
| 18 years and over | 2,248 |
| 21 years and over | 2,179 |
| 62 years and over | 372 |
| 65 years and over | 304 |
| Total population | 3,008 |
| One race | 2,884 |
| White | 2,591 |
| Black or African American | 70 |
| American Indian and Alaska Native | 28 |
| Asian | 83 |
| Native Hawaiian and Other Pacific Islander | 0 |
| Some other race | 112 |
| Two or more races | 124 |
| Citizen, VOTING AGE 18 and over population | 2,147 |
| Male Citizen, VOTING AGE 18 and over population | 1,006 |
| Female Citizen, VOTING AGE 18 and over population | 1,141 |
Social characteristics in TIFFIN, IA
| Total households | 1,190 |
| Family households (families) | 788 |
| Married-couple family | 635 |
| Male householder, no wife present, family | 15 |
| Female householder, no husband present, family | 138 |
| Nonfamily households | 402 |
| Average household size | 2.53 |
| Average family size | 3.01 |
Economic characteristics in TIFFIN, IA
| Total households | 1,190 |
| Less than $10,000 | 3 |
| $10,000 to $14,999 | 33 |
| $15,000 to $24,999 | 96 |
| $25,000 to $34,999 | 60 |
| $35,000 to $49,999 | 199 |
| $50,000 to $74,999 | 188 |
| $75,000 to $99,999 | 319 |
| $100,000 to $149,999 | 192 |
| $150,000 to $199,999 | 60 |
| $200,000 or more | 40 |
| Median household income (dollars) | 76,250 |
Housing characteristics in TIFFIN, IA
| Total housing units | 1,298 |
| Occupied housing units | 1,190 |
| Vacant housing units | 108 |
| Total housing units | 1,298 |
| 1-unit, detached | 556 |
| 1-unit, attached | 289 |
| 2 units | 0 |
| 3 or 4 units | 22 |
| 5 to 9 units | 91 |
| 10 to 19 units | 268 |
| 20 or more units | 0 |
| Mobile home | 72 |
| Boat, RV, van, etc. | 0 |
| Total housing units | 1,298 |
| Built 2014 or later | 348 |
| Built 2010 to 2013 | 118 |
| Built 2000 to 2009 | 354 |
| Built 1990 to 1999 | 280 |
| Built 1980 to 1989 | 26 |
| Built 1970 to 1979 | 73 |
| Built 1960 to 1969 | 6 |
| Built 1950 to 1959 | 50 |
| Built 1940 to 1949 | 11 |
| Built 1939 or earlier | 32 |
| Total housing units | 1,298 |
| 1 room | 0 |
| 2 rooms | 0 |
| 3 rooms | 227 |
| 4 rooms | 252 |
| 5 rooms | 196 |
| 6 rooms | 164 |
| 7 rooms | 123 |
| 8 rooms | 118 |
| 9 rooms or more | 218 |
| Median rooms | 5.4 |
| Total housing units | 1,298 |
| No bedroom | 0 |
| 1 bedroom | 12 |
| 2 bedrooms | 481 |
| 3 bedrooms | 384 |
| 4 bedrooms | 256 |
| 5 or more bedrooms | 165 |
| Occupied housing units | 1,190 |
| Owner-occupied | 778 |
| Renter-occupied | 412 |
| Average household size of owner-occupied unit | 2.66 |
| Average household size of renter-occupied unit | 2.27 |
| Occupied housing units | 1,190 |
| Moved in 2017 or later | 183 |
| Moved in 2015 to 2016 | 249 |
| Moved in 2010 to 2014 | 392 |
| Moved in 2000 to 2009 | 275 |
| Moved in 1990 to 1999 | 45 |
| Moved in 1989 and earlier | 46 |
| Owner-occupied units | 778 |
| Less than $50,000 | 91 |
| $50,000 to $99,999 | 22 |
| $100,000 to $149,999 | 49 |
| $150,000 to $199,999 | 113 |
| $200,000 to $299,999 | 323 |
| $300,000 to $499,999 | 167 |
| $500,000 to $999,999 | 13 |
| $1,000,000 or more | 0 |
| Median (dollars) | 231,300 |
| Owner-occupied units | 778 |
| Housing units with a mortgage | 623 |
| Housing units without a mortgage | 155 |
| Occupied units paying rent | 402 |
| Less than $500 | 0 |
| $500 to $999 | 217 |
| $1,000 to $1,499 | 97 |
| $1,500 to $1,999 | 88 |
| $2,000 to $2,499 | 0 |
| $2,500 to $2,999 | 0 |
| $3,000 or more | 0 |
| Median (dollars) | 987 |
| No rent paid | 10 |
Data is based on 2018 Census
ZIP Codes for other locations
State for TIFFIN
Iowa ZIP CodesOther cities in Iowa