ALSIP, IL ZIP Code
| City | ALSIP |
| State | Illinois |
| ZIP Codes count | 1 (see all) |
| Post offices count | 1 (see all) |
| Total population | 19,179 (see all) |
ZIP Code in ALSIP, Illinois
60803
This list contains only 5-digit ZIP codes. Use our zip code lookup by address feature to get the full 9-digit (ZIP+4) code.
List of ALSIP, IL ZIP Codes
| ZIP | TYPE | POPU |
|---|---|---|
| 60803 | STANDARD | 22,329 |
Post offices
MOUNT GREENWOOD — Post Office™ 3349 W 111TH ST CHICAGO, IL 60655-9998 |
Envelope example
On the bottom center of the envelope, write the address you want your letter delivered to. Include the following on separate lines:
- Recipient's full name
- Full street address
- City, State, and ZIP Code
Using the same format, write the return address in the top left corner.
Using the full ZIP+4 Code when mailing via the USPS ensures the fastest, most accurate mailing possible. If you are not sure of the full 9-digit ZIP Code, use the 5-digit ZIP Code to avoid loss of letter or package.
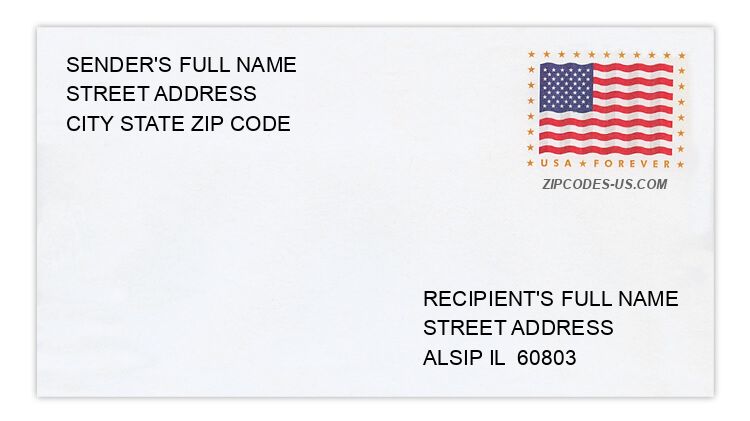
The recipient address information is provided for your reference.
Address example
89 GRIFFITH CTR
ALSIP IL 60803-4700
ALSIP IL 60803-4700
11842 S HARDING AVE
ALSIP IL 60803-4217
ALSIP IL 60803-4217
12683 S LARAMIE AVE
ALSIP IL 60803-3225
ALSIP IL 60803-3225
12834 S ORCHARD LN
ALSIP IL 60803-2744
ALSIP IL 60803-2744
3895 W 127TH PL
ALSIP IL 60803-1510
ALSIP IL 60803-1510
5331 W DIXIE DR
ALSIP IL 60803-5136
ALSIP IL 60803-5136
Map
Hover over the map to see the ZIP code
Census data for ALSIP, IL
Demographic and housing estimates in ALSIP, IL
| Total population | 19,179 |
| Male | 9,566 |
| Female | 9,613 |
| Total population | 19,179 |
| Under 5 years | 1,083 |
| 5 to 9 years | 1,379 |
| 10 to 14 years | 1,352 |
| 15 to 19 years | 1,260 |
| 20 to 24 years | 1,243 |
| 25 to 34 years | 2,889 |
| 35 to 44 years | 2,481 |
| 45 to 54 years | 2,137 |
| 55 to 59 years | 1,488 |
| 60 to 64 years | 987 |
| 65 to 74 years | 1,827 |
| 75 to 84 years | 731 |
| 85 years and over | 322 |
| Median age (years) | 36.1 |
| Under 18 years | 4,556 |
| 16 years and over | 15,284 |
| 18 years and over | 14,623 |
| 21 years and over | 13,919 |
| 62 years and over | 3,621 |
| 65 years and over | 2,880 |
| Total population | 19,179 |
| One race | 18,641 |
| White | 12,818 |
| Black or African American | 4,402 |
| American Indian and Alaska Native | 27 |
| Asian | 217 |
| Native Hawaiian and Other Pacific Islander | 0 |
| Some other race | 1,177 |
| Two or more races | 538 |
| Citizen, VOTING AGE 18 and over population | 13,886 |
| Male Citizen, VOTING AGE 18 and over population | 6,727 |
| Female Citizen, VOTING AGE 18 and over population | 7,159 |
Social characteristics in ALSIP, IL
| Total households | 7,213 |
| Family households (families) | 4,542 |
| Married-couple family | 2,894 |
| Male householder, no wife present, family | 620 |
| Female householder, no husband present, family | 1,028 |
| Nonfamily households | 2,671 |
| Average household size | 2.65 |
| Average family size | 3.36 |
Economic characteristics in ALSIP, IL
| Total households | 7,213 |
| Less than $10,000 | 455 |
| $10,000 to $14,999 | 173 |
| $15,000 to $24,999 | 621 |
| $25,000 to $34,999 | 855 |
| $35,000 to $49,999 | 1,084 |
| $50,000 to $74,999 | 1,377 |
| $75,000 to $99,999 | 856 |
| $100,000 to $149,999 | 1,220 |
| $150,000 to $199,999 | 389 |
| $200,000 or more | 183 |
| Median household income (dollars) | 58,566 |
Housing characteristics in ALSIP, IL
| Total housing units | 7,597 |
| Occupied housing units | 7,213 |
| Vacant housing units | 384 |
| Total housing units | 7,597 |
| 1-unit, detached | 3,771 |
| 1-unit, attached | 403 |
| 2 units | 80 |
| 3 or 4 units | 492 |
| 5 to 9 units | 1,150 |
| 10 to 19 units | 1,058 |
| 20 or more units | 643 |
| Mobile home | 0 |
| Boat, RV, van, etc. | 0 |
| Total housing units | 7,597 |
| Built 2014 or later | 0 |
| Built 2010 to 2013 | 7 |
| Built 2000 to 2009 | 341 |
| Built 1990 to 1999 | 1,029 |
| Built 1980 to 1989 | 1,087 |
| Built 1970 to 1979 | 2,132 |
| Built 1960 to 1969 | 1,836 |
| Built 1950 to 1959 | 980 |
| Built 1940 to 1949 | 93 |
| Built 1939 or earlier | 92 |
| Total housing units | 7,597 |
| 1 room | 52 |
| 2 rooms | 90 |
| 3 rooms | 685 |
| 4 rooms | 1,871 |
| 5 rooms | 1,599 |
| 6 rooms | 1,309 |
| 7 rooms | 1,219 |
| 8 rooms | 399 |
| 9 rooms or more | 373 |
| Median rooms | 5.2 |
| Total housing units | 7,597 |
| No bedroom | 66 |
| 1 bedroom | 791 |
| 2 bedrooms | 2,825 |
| 3 bedrooms | 3,077 |
| 4 bedrooms | 593 |
| 5 or more bedrooms | 245 |
| Occupied housing units | 7,213 |
| Owner-occupied | 4,279 |
| Renter-occupied | 2,934 |
| Average household size of owner-occupied unit | 2.85 |
| Average household size of renter-occupied unit | 2.36 |
| Occupied housing units | 7,213 |
| Moved in 2017 or later | 270 |
| Moved in 2015 to 2016 | 755 |
| Moved in 2010 to 2014 | 1,704 |
| Moved in 2000 to 2009 | 2,396 |
| Moved in 1990 to 1999 | 1,050 |
| Moved in 1989 and earlier | 1,038 |
| Owner-occupied units | 4,279 |
| Less than $50,000 | 120 |
| $50,000 to $99,999 | 519 |
| $100,000 to $149,999 | 666 |
| $150,000 to $199,999 | 1,725 |
| $200,000 to $299,999 | 1,059 |
| $300,000 to $499,999 | 190 |
| $500,000 to $999,999 | 0 |
| $1,000,000 or more | 0 |
| Median (dollars) | 172,300 |
| Owner-occupied units | 4,279 |
| Housing units with a mortgage | 3,078 |
| Housing units without a mortgage | 1,201 |
| Occupied units paying rent | 2,840 |
| Less than $500 | 69 |
| $500 to $999 | 1,737 |
| $1,000 to $1,499 | 779 |
| $1,500 to $1,999 | 162 |
| $2,000 to $2,499 | 93 |
| $2,500 to $2,999 | 0 |
| $3,000 or more | 0 |
| Median (dollars) | 947 |
| No rent paid | 94 |
Data is based on 2018 Census
ZIP Codes for other locations
State for ALSIP
Illinois ZIP CodesOther cities in Illinois