BEMENT, IL ZIP Code
| City | BEMENT |
| State | Illinois |
| ZIP Codes count | 1 (see all) |
| Post offices count | 1 (see all) |
| Total population | 1,502 (see all) |
ZIP Code in BEMENT, Illinois
61813
This list contains only 5-digit ZIP codes. Use our zip code lookup by address feature to get the full 9-digit (ZIP+4) code.
List of BEMENT, IL ZIP Codes
| ZIP | TYPE | POPU |
|---|---|---|
| 61813 | STANDARD | 1,677 |
Post offices
BEMENT — Post Office™ 200 E BODMAN ST BEMENT, IL 61813-9998 |
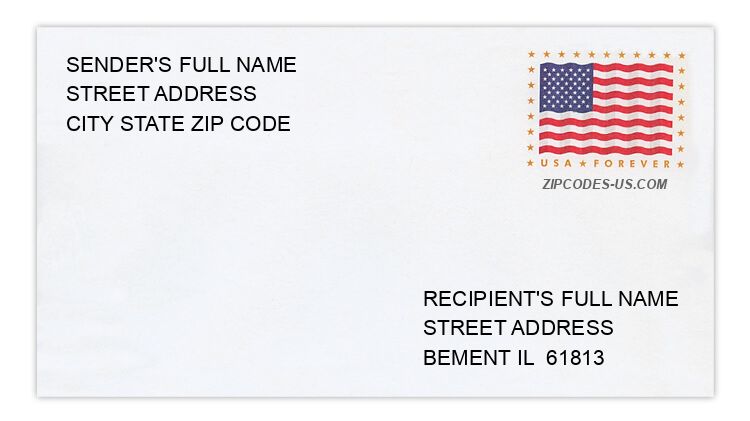
Envelope example
On the bottom center of the envelope, write the address you want your letter delivered to. Include the following on separate lines:
- Recipient's full name
- Full street address
- City, State, and ZIP Code
Using the same format, write the return address in the top left corner.
Using the full ZIP+4 Code when mailing via the USPS ensures the fastest, most accurate mailing possible. If you are not sure of the full 9-digit ZIP Code, use the 5-digit ZIP Code to avoid loss of letter or package.
The recipient address information is provided for your reference.
Address example
36 COACHMAN DR
BEMENT IL 61813-1003
BEMENT IL 61813-1003
974 E 500 NORTH RD
BEMENT IL 61813-3557
BEMENT IL 61813-3557
258 E PROVINE ST
BEMENT IL 61813-1079
BEMENT IL 61813-1079
840 N 1250 EAST RD
BEMENT IL 61813-3523
BEMENT IL 61813-3523
311 N CHAMPAIGN ST
BEMENT IL 61813-1107
BEMENT IL 61813-1107
176 W SPRAGUE ST
BEMENT IL 61813-1167
BEMENT IL 61813-1167
Map
Hover over the map to see the ZIP code
Census data for BEMENT, IL
Demographic and housing estimates in BEMENT, IL
| Total population | 1,502 |
| Male | 742 |
| Female | 760 |
| Total population | 1,502 |
| Under 5 years | 45 |
| 5 to 9 years | 83 |
| 10 to 14 years | 91 |
| 15 to 19 years | 114 |
| 20 to 24 years | 66 |
| 25 to 34 years | 130 |
| 35 to 44 years | 227 |
| 45 to 54 years | 237 |
| 55 to 59 years | 136 |
| 60 to 64 years | 101 |
| 65 to 74 years | 156 |
| 75 to 84 years | 89 |
| 85 years and over | 27 |
| Median age (years) | 44.8 |
| Under 18 years | 291 |
| 16 years and over | 1,271 |
| 18 years and over | 1,211 |
| 21 years and over | 1,135 |
| 62 years and over | 336 |
| 65 years and over | 272 |
| Total population | 1,502 |
| One race | 1,482 |
| White | 1,444 |
| Black or African American | 34 |
| American Indian and Alaska Native | 0 |
| Asian | 4 |
| Native Hawaiian and Other Pacific Islander | 0 |
| Some other race | 0 |
| Two or more races | 20 |
| Citizen, VOTING AGE 18 and over population | 1,199 |
| Male Citizen, VOTING AGE 18 and over population | 583 |
| Female Citizen, VOTING AGE 18 and over population | 616 |
Social characteristics in BEMENT, IL
| Total households | 606 |
| Family households (families) | 424 |
| Married-couple family | 310 |
| Male householder, no wife present, family | 27 |
| Female householder, no husband present, family | 87 |
| Nonfamily households | 182 |
| Average household size | 2.41 |
| Average family size | 2.91 |
Economic characteristics in BEMENT, IL
| Total households | 606 |
| Less than $10,000 | 31 |
| $10,000 to $14,999 | 9 |
| $15,000 to $24,999 | 70 |
| $25,000 to $34,999 | 74 |
| $35,000 to $49,999 | 150 |
| $50,000 to $74,999 | 86 |
| $75,000 to $99,999 | 66 |
| $100,000 to $149,999 | 87 |
| $150,000 to $199,999 | 15 |
| $200,000 or more | 18 |
| Median household income (dollars) | 46,719 |
Housing characteristics in BEMENT, IL
| Total housing units | 704 |
| Occupied housing units | 606 |
| Vacant housing units | 98 |
| Total housing units | 704 |
| 1-unit, detached | 646 |
| 1-unit, attached | 3 |
| 2 units | 8 |
| 3 or 4 units | 14 |
| 5 to 9 units | 12 |
| 10 to 19 units | 0 |
| 20 or more units | 0 |
| Mobile home | 21 |
| Boat, RV, van, etc. | 0 |
| Total housing units | 704 |
| Built 2014 or later | 0 |
| Built 2010 to 2013 | 0 |
| Built 2000 to 2009 | 10 |
| Built 1990 to 1999 | 41 |
| Built 1980 to 1989 | 40 |
| Built 1970 to 1979 | 159 |
| Built 1960 to 1969 | 102 |
| Built 1950 to 1959 | 88 |
| Built 1940 to 1949 | 39 |
| Built 1939 or earlier | 225 |
| Total housing units | 704 |
| 1 room | 2 |
| 2 rooms | 0 |
| 3 rooms | 23 |
| 4 rooms | 42 |
| 5 rooms | 169 |
| 6 rooms | 140 |
| 7 rooms | 151 |
| 8 rooms | 102 |
| 9 rooms or more | 75 |
| Median rooms | 6.3 |
| Total housing units | 704 |
| No bedroom | 2 |
| 1 bedroom | 22 |
| 2 bedrooms | 167 |
| 3 bedrooms | 370 |
| 4 bedrooms | 129 |
| 5 or more bedrooms | 14 |
| Occupied housing units | 606 |
| Owner-occupied | 496 |
| Renter-occupied | 110 |
| Average household size of owner-occupied unit | 2.34 |
| Average household size of renter-occupied unit | 2.71 |
| Occupied housing units | 606 |
| Moved in 2017 or later | 37 |
| Moved in 2015 to 2016 | 76 |
| Moved in 2010 to 2014 | 113 |
| Moved in 2000 to 2009 | 178 |
| Moved in 1990 to 1999 | 68 |
| Moved in 1989 and earlier | 134 |
| Owner-occupied units | 496 |
| Less than $50,000 | 73 |
| $50,000 to $99,999 | 224 |
| $100,000 to $149,999 | 166 |
| $150,000 to $199,999 | 21 |
| $200,000 to $299,999 | 9 |
| $300,000 to $499,999 | 0 |
| $500,000 to $999,999 | 3 |
| $1,000,000 or more | 0 |
| Median (dollars) | 88,300 |
| Owner-occupied units | 496 |
| Housing units with a mortgage | 295 |
| Housing units without a mortgage | 201 |
| Occupied units paying rent | 106 |
| Less than $500 | 16 |
| $500 to $999 | 78 |
| $1,000 to $1,499 | 12 |
| $1,500 to $1,999 | 0 |
| $2,000 to $2,499 | 0 |
| $2,500 to $2,999 | 0 |
| $3,000 or more | 0 |
| Median (dollars) | 693 |
| No rent paid | 4 |
Data is based on 2018 Census
ZIP Codes for other locations
State for BEMENT
Illinois ZIP CodesOther cities in Illinois