BONDVILLE, IL ZIP Code
| City | BONDVILLE |
| State | Illinois |
| ZIP Codes count | 1 (see all) |
| Post offices count | 1 (see all) |
| Total population | 455 (see all) |
ZIP Code in BONDVILLE, Illinois
61815
This list contains only 5-digit ZIP codes. Use our zip code lookup by address feature to get the full 9-digit (ZIP+4) code.
List of BONDVILLE, IL ZIP Codes
| ZIP | TYPE | POPU |
|---|---|---|
| 61815 | PO BOX | 333 |
Post offices
NEIL STREET — Post Office™ 600 N NEIL ST CHAMPAIGN, IL 61820-9997 |
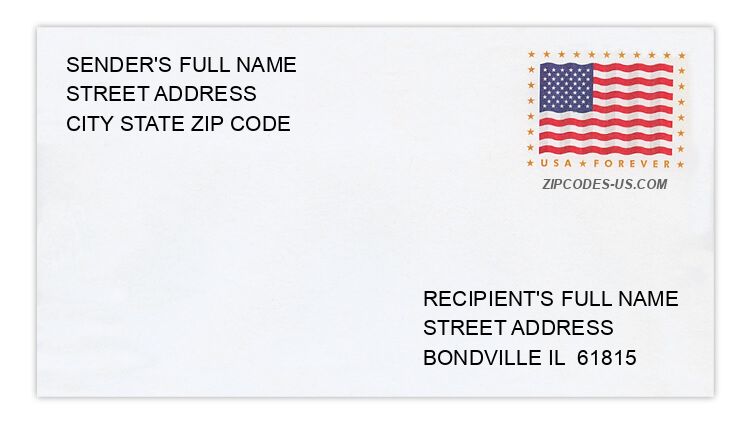
Envelope example
On the bottom center of the envelope, write the address you want your letter delivered to. Include the following on separate lines:
- Recipient's full name
- Full street address
- City, State, and ZIP Code
Using the same format, write the return address in the top left corner.
Using the full ZIP+4 Code when mailing via the USPS ensures the fastest, most accurate mailing possible. If you are not sure of the full 9-digit ZIP Code, use the 5-digit ZIP Code to avoid loss of letter or package.
The recipient address information is provided for your reference.
Address example
136 W CHESTNUT ST
BONDVILLE IL 61815-3416
BONDVILLE IL 61815-3416
203 W ASH ST
BONDVILLE IL 61815-3401
BONDVILLE IL 61815-3401
506 S WALNUT ST
BONDVILLE IL 61815-3450
BONDVILLE IL 61815-3450
336 S MARKET ST
BONDVILLE IL 61815-3428
BONDVILLE IL 61815-3428
208 S WALNUT ST
BONDVILLE IL 61815-3444
BONDVILLE IL 61815-3444
382 N MARKET ST
BONDVILLE IL 61815-3420
BONDVILLE IL 61815-3420
Map
Hover over the map to see the ZIP code
Census data for BONDVILLE, IL
Demographic and housing estimates in BONDVILLE, IL
| Total population | 455 |
| Male | 237 |
| Female | 218 |
| Total population | 455 |
| Under 5 years | 24 |
| 5 to 9 years | 6 |
| 10 to 14 years | 18 |
| 15 to 19 years | 33 |
| 20 to 24 years | 48 |
| 25 to 34 years | 35 |
| 35 to 44 years | 54 |
| 45 to 54 years | 86 |
| 55 to 59 years | 42 |
| 60 to 64 years | 27 |
| 65 to 74 years | 43 |
| 75 to 84 years | 17 |
| 85 years and over | 22 |
| Median age (years) | 46.2 |
| Under 18 years | 61 |
| 16 years and over | 405 |
| 18 years and over | 394 |
| 21 years and over | 367 |
| 62 years and over | 94 |
| 65 years and over | 82 |
| Total population | 455 |
| One race | 443 |
| White | 425 |
| Black or African American | 6 |
| American Indian and Alaska Native | 2 |
| Asian | 3 |
| Native Hawaiian and Other Pacific Islander | 0 |
| Some other race | 7 |
| Two or more races | 12 |
| Citizen, VOTING AGE 18 and over population | 382 |
| Male Citizen, VOTING AGE 18 and over population | 198 |
| Female Citizen, VOTING AGE 18 and over population | 184 |
Social characteristics in BONDVILLE, IL
| Total households | 199 |
| Family households (families) | 121 |
| Married-couple family | 97 |
| Male householder, no wife present, family | 19 |
| Female householder, no husband present, family | 5 |
| Nonfamily households | 78 |
| Average household size | 2.29 |
| Average family size | 2.75 |
Economic characteristics in BONDVILLE, IL
| Total households | 199 |
| Less than $10,000 | 26 |
| $10,000 to $14,999 | 16 |
| $15,000 to $24,999 | 7 |
| $25,000 to $34,999 | 18 |
| $35,000 to $49,999 | 26 |
| $50,000 to $74,999 | 51 |
| $75,000 to $99,999 | 10 |
| $100,000 to $149,999 | 36 |
| $150,000 to $199,999 | 6 |
| $200,000 or more | 3 |
| Median household income (dollars) | 55,234 |
Housing characteristics in BONDVILLE, IL
| Total housing units | 221 |
| Occupied housing units | 199 |
| Vacant housing units | 22 |
| Total housing units | 221 |
| 1-unit, detached | 149 |
| 1-unit, attached | 7 |
| 2 units | 5 |
| 3 or 4 units | 0 |
| 5 to 9 units | 1 |
| 10 to 19 units | 0 |
| 20 or more units | 0 |
| Mobile home | 59 |
| Boat, RV, van, etc. | 0 |
| Total housing units | 221 |
| Built 2014 or later | 0 |
| Built 2010 to 2013 | 1 |
| Built 2000 to 2009 | 4 |
| Built 1990 to 1999 | 26 |
| Built 1980 to 1989 | 14 |
| Built 1970 to 1979 | 48 |
| Built 1960 to 1969 | 34 |
| Built 1950 to 1959 | 18 |
| Built 1940 to 1949 | 16 |
| Built 1939 or earlier | 60 |
| Total housing units | 221 |
| 1 room | 4 |
| 2 rooms | 0 |
| 3 rooms | 14 |
| 4 rooms | 35 |
| 5 rooms | 51 |
| 6 rooms | 56 |
| 7 rooms | 19 |
| 8 rooms | 22 |
| 9 rooms or more | 20 |
| Median rooms | 5.6 |
| Total housing units | 221 |
| No bedroom | 4 |
| 1 bedroom | 9 |
| 2 bedrooms | 76 |
| 3 bedrooms | 101 |
| 4 bedrooms | 26 |
| 5 or more bedrooms | 5 |
| Occupied housing units | 199 |
| Owner-occupied | 126 |
| Renter-occupied | 73 |
| Average household size of owner-occupied unit | 2.31 |
| Average household size of renter-occupied unit | 2.25 |
| Occupied housing units | 199 |
| Moved in 2017 or later | 11 |
| Moved in 2015 to 2016 | 33 |
| Moved in 2010 to 2014 | 40 |
| Moved in 2000 to 2009 | 52 |
| Moved in 1990 to 1999 | 30 |
| Moved in 1989 and earlier | 33 |
| Owner-occupied units | 126 |
| Less than $50,000 | 23 |
| $50,000 to $99,999 | 26 |
| $100,000 to $149,999 | 48 |
| $150,000 to $199,999 | 24 |
| $200,000 to $299,999 | 4 |
| $300,000 to $499,999 | 0 |
| $500,000 to $999,999 | 1 |
| $1,000,000 or more | 0 |
| Median (dollars) | 113,000 |
| Owner-occupied units | 126 |
| Housing units with a mortgage | 70 |
| Housing units without a mortgage | 56 |
| Occupied units paying rent | 68 |
| Less than $500 | 1 |
| $500 to $999 | 60 |
| $1,000 to $1,499 | 7 |
| $1,500 to $1,999 | 0 |
| $2,000 to $2,499 | 0 |
| $2,500 to $2,999 | 0 |
| $3,000 or more | 0 |
| Median (dollars) | 838 |
| No rent paid | 5 |
Data is based on 2018 Census
ZIP Codes for other locations
State for BONDVILLE
Illinois ZIP CodesOther cities in Illinois