CORTLAND, IL ZIP Code
| City | CORTLAND |
| State | Illinois |
| ZIP Codes count | 1 (see all) |
| Post offices count | 2 (see all) |
| Total population | 4,087 (see all) |
ZIP Code in CORTLAND, Illinois
60112
This list contains only 5-digit ZIP codes. Use our zip code lookup by address feature to get the full 9-digit (ZIP+4) code.
List of CORTLAND, IL ZIP Codes
| ZIP | TYPE | POPU |
|---|---|---|
| 60112 | STANDARD | 4,515 |
Post offices
CORTLAND — Post Office™ 50 S SOMONAUK RD CORTLAND, IL 60112-4071 |
SYCAMORE — Post Office™ 104 E STATE ST SYCAMORE, IL 60178-1467 |
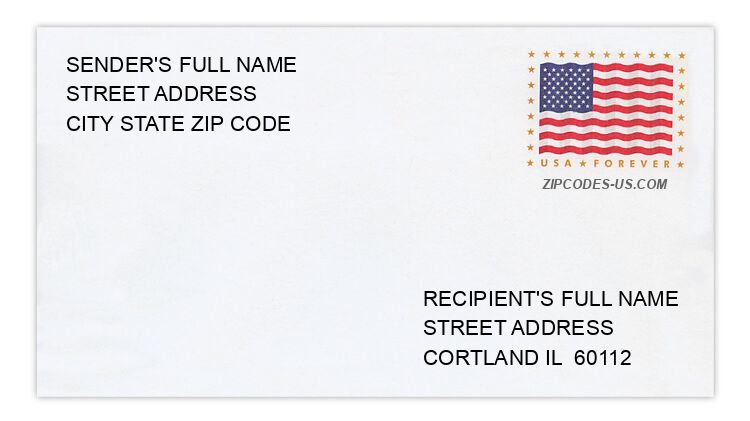
Envelope example
On the bottom center of the envelope, write the address you want your letter delivered to. Include the following on separate lines:
- Recipient's full name
- Full street address
- City, State, and ZIP Code
Using the same format, write the return address in the top left corner.
Using the full ZIP+4 Code when mailing via the USPS ensures the fastest, most accurate mailing possible. If you are not sure of the full 9-digit ZIP Code, use the 5-digit ZIP Code to avoid loss of letter or package.
The recipient address information is provided for your reference.
Address example
431 E LEXINGTON AVE
CORTLAND IL 60112-4416
CORTLAND IL 60112-4416
4304 ELM ST
CORTLAND IL 60112-1702
CORTLAND IL 60112-1702
4401 GEORGE AVE
CORTLAND IL 60112-1740
CORTLAND IL 60112-1740
577 N STRACK ST
CORTLAND IL 60112-4122
CORTLAND IL 60112-4122
2211 SOMONAUK RD
CORTLAND IL 60112-1670
CORTLAND IL 60112-1670
132 W BENSON AVE
CORTLAND IL 60112-4006
CORTLAND IL 60112-4006
Map
Hover over the map to see the ZIP code
Census data for CORTLAND, IL
Demographic and housing estimates in CORTLAND, IL
| Total population | 4,087 |
| Male | 2,166 |
| Female | 1,921 |
| Total population | 4,087 |
| Under 5 years | 371 |
| 5 to 9 years | 409 |
| 10 to 14 years | 348 |
| 15 to 19 years | 130 |
| 20 to 24 years | 345 |
| 25 to 34 years | 918 |
| 35 to 44 years | 792 |
| 45 to 54 years | 343 |
| 55 to 59 years | 163 |
| 60 to 64 years | 82 |
| 65 to 74 years | 130 |
| 75 to 84 years | 19 |
| 85 years and over | 37 |
| Median age (years) | 30.5 |
| Under 18 years | 1,235 |
| 16 years and over | 2,917 |
| 18 years and over | 2,852 |
| 21 years and over | 2,693 |
| 62 years and over | 216 |
| 65 years and over | 186 |
| Total population | 4,087 |
| One race | 4,056 |
| White | 3,626 |
| Black or African American | 325 |
| American Indian and Alaska Native | 0 |
| Asian | 79 |
| Native Hawaiian and Other Pacific Islander | 0 |
| Some other race | 26 |
| Two or more races | 31 |
| Citizen, VOTING AGE 18 and over population | 2,686 |
| Male Citizen, VOTING AGE 18 and over population | 1,473 |
| Female Citizen, VOTING AGE 18 and over population | 1,213 |
Social characteristics in CORTLAND, IL
| Total households | 1,342 |
| Family households (families) | 999 |
| Married-couple family | 791 |
| Male householder, no wife present, family | 113 |
| Female householder, no husband present, family | 95 |
| Nonfamily households | 343 |
| Average household size | 3.05 |
| Average family size | 3.48 |
Economic characteristics in CORTLAND, IL
| Total households | 1,342 |
| Less than $10,000 | 12 |
| $10,000 to $14,999 | 0 |
| $15,000 to $24,999 | 61 |
| $25,000 to $34,999 | 55 |
| $35,000 to $49,999 | 119 |
| $50,000 to $74,999 | 415 |
| $75,000 to $99,999 | 215 |
| $100,000 to $149,999 | 385 |
| $150,000 to $199,999 | 48 |
| $200,000 or more | 32 |
| Median household income (dollars) | 76,607 |
Housing characteristics in CORTLAND, IL
| Total housing units | 1,470 |
| Occupied housing units | 1,342 |
| Vacant housing units | 128 |
| Total housing units | 1,470 |
| 1-unit, detached | 983 |
| 1-unit, attached | 353 |
| 2 units | 6 |
| 3 or 4 units | 31 |
| 5 to 9 units | 87 |
| 10 to 19 units | 10 |
| 20 or more units | 0 |
| Mobile home | 0 |
| Boat, RV, van, etc. | 0 |
| Total housing units | 1,470 |
| Built 2014 or later | 0 |
| Built 2010 to 2013 | 26 |
| Built 2000 to 2009 | 981 |
| Built 1990 to 1999 | 231 |
| Built 1980 to 1989 | 49 |
| Built 1970 to 1979 | 59 |
| Built 1960 to 1969 | 6 |
| Built 1950 to 1959 | 94 |
| Built 1940 to 1949 | 18 |
| Built 1939 or earlier | 6 |
| Total housing units | 1,470 |
| 1 room | 0 |
| 2 rooms | 0 |
| 3 rooms | 61 |
| 4 rooms | 129 |
| 5 rooms | 396 |
| 6 rooms | 264 |
| 7 rooms | 294 |
| 8 rooms | 141 |
| 9 rooms or more | 185 |
| Median rooms | 6.1 |
| Total housing units | 1,470 |
| No bedroom | 0 |
| 1 bedroom | 0 |
| 2 bedrooms | 291 |
| 3 bedrooms | 912 |
| 4 bedrooms | 250 |
| 5 or more bedrooms | 17 |
| Occupied housing units | 1,342 |
| Owner-occupied | 1,056 |
| Renter-occupied | 286 |
| Average household size of owner-occupied unit | 3.15 |
| Average household size of renter-occupied unit | 2.64 |
| Occupied housing units | 1,342 |
| Moved in 2017 or later | 117 |
| Moved in 2015 to 2016 | 149 |
| Moved in 2010 to 2014 | 263 |
| Moved in 2000 to 2009 | 671 |
| Moved in 1990 to 1999 | 95 |
| Moved in 1989 and earlier | 47 |
| Owner-occupied units | 1,056 |
| Less than $50,000 | 41 |
| $50,000 to $99,999 | 31 |
| $100,000 to $149,999 | 383 |
| $150,000 to $199,999 | 496 |
| $200,000 to $299,999 | 90 |
| $300,000 to $499,999 | 9 |
| $500,000 to $999,999 | 6 |
| $1,000,000 or more | 0 |
| Median (dollars) | 155,500 |
| Owner-occupied units | 1,056 |
| Housing units with a mortgage | 894 |
| Housing units without a mortgage | 162 |
| Occupied units paying rent | 277 |
| Less than $500 | 0 |
| $500 to $999 | 92 |
| $1,000 to $1,499 | 148 |
| $1,500 to $1,999 | 37 |
| $2,000 to $2,499 | 0 |
| $2,500 to $2,999 | 0 |
| $3,000 or more | 0 |
| Median (dollars) | 1,149 |
| No rent paid | 9 |
Data is based on 2018 Census
ZIP Codes for other locations
State for CORTLAND
Illinois ZIP CodesOther cities in Illinois