CRETE, IL ZIP Code
| City | CRETE |
| State | Illinois |
| ZIP Codes count | 1 (see all) |
| Post offices count | 1 (see all) |
| Total population | 8,184 (see all) |
ZIP Code in CRETE, Illinois
60417
This list contains only 5-digit ZIP codes. Use our zip code lookup by address feature to get the full 9-digit (ZIP+4) code.
List of CRETE, IL ZIP Codes
| ZIP | TYPE | POPU |
|---|---|---|
| 60417 | STANDARD | 15,607 |
Post offices
CRETE — Post Office™ 515 CASS ST CRETE, IL 60417-9998 |
Envelope example
On the bottom center of the envelope, write the address you want your letter delivered to. Include the following on separate lines:
- Recipient's full name
- Full street address
- City, State, and ZIP Code
Using the same format, write the return address in the top left corner.
Using the full ZIP+4 Code when mailing via the USPS ensures the fastest, most accurate mailing possible. If you are not sure of the full 9-digit ZIP Code, use the 5-digit ZIP Code to avoid loss of letter or package.
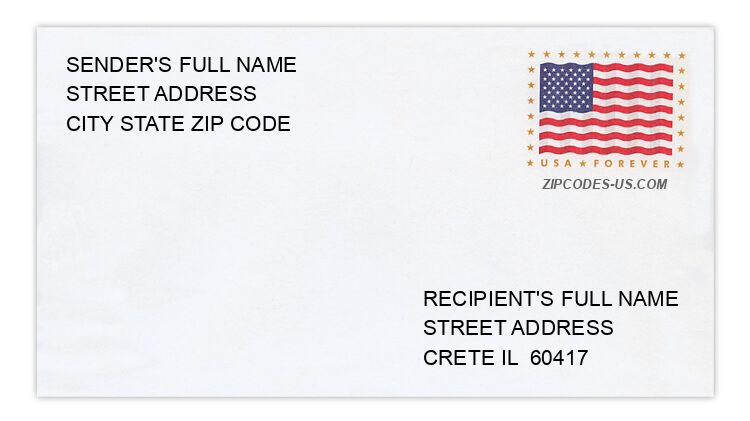
The recipient address information is provided for your reference.
Address example
219 BRACKMANN AVE
CRETE IL 60417-3205
CRETE IL 60417-3205
23736 E JONATHAN LN
CRETE IL 60417-1719
CRETE IL 60417-1719
633 HUNTLEY TER
CRETE IL 60417-1228
CRETE IL 60417-1228
1284 REVERE CT
CRETE IL 60417-2068
CRETE IL 60417-2068
25678 S MARY LN
CRETE IL 60417-4103
CRETE IL 60417-4103
2224 W THORN LN
CRETE IL 60417-9656
CRETE IL 60417-9656
Map
Hover over the map to see the ZIP code
Census data for CRETE, IL
Demographic and housing estimates in CRETE, IL
| Total population | 8,184 |
| Male | 4,010 |
| Female | 4,174 |
| Total population | 8,184 |
| Under 5 years | 390 |
| 5 to 9 years | 419 |
| 10 to 14 years | 465 |
| 15 to 19 years | 580 |
| 20 to 24 years | 469 |
| 25 to 34 years | 743 |
| 35 to 44 years | 928 |
| 45 to 54 years | 1,242 |
| 55 to 59 years | 621 |
| 60 to 64 years | 604 |
| 65 to 74 years | 988 |
| 75 to 84 years | 482 |
| 85 years and over | 253 |
| Median age (years) | 45.9 |
| Under 18 years | 1,637 |
| 16 years and over | 6,784 |
| 18 years and over | 6,547 |
| 21 years and over | 6,218 |
| 62 years and over | 2,041 |
| 65 years and over | 1,723 |
| Total population | 8,184 |
| One race | 7,925 |
| White | 4,806 |
| Black or African American | 2,659 |
| American Indian and Alaska Native | 35 |
| Asian | 28 |
| Native Hawaiian and Other Pacific Islander | 0 |
| Some other race | 397 |
| Two or more races | 259 |
| Citizen, VOTING AGE 18 and over population | 6,421 |
| Male Citizen, VOTING AGE 18 and over population | 3,078 |
| Female Citizen, VOTING AGE 18 and over population | 3,343 |
Social characteristics in CRETE, IL
| Total households | 3,063 |
| Family households (families) | 2,040 |
| Married-couple family | 1,580 |
| Male householder, no wife present, family | 74 |
| Female householder, no husband present, family | 386 |
| Nonfamily households | 1,023 |
| Average household size | 2.64 |
| Average family size | 3.36 |
Economic characteristics in CRETE, IL
| Total households | 3,063 |
| Less than $10,000 | 85 |
| $10,000 to $14,999 | 62 |
| $15,000 to $24,999 | 291 |
| $25,000 to $34,999 | 169 |
| $35,000 to $49,999 | 397 |
| $50,000 to $74,999 | 573 |
| $75,000 to $99,999 | 414 |
| $100,000 to $149,999 | 575 |
| $150,000 to $199,999 | 281 |
| $200,000 or more | 216 |
| Median household income (dollars) | 73,736 |
Housing characteristics in CRETE, IL
| Total housing units | 3,457 |
| Occupied housing units | 3,063 |
| Vacant housing units | 394 |
| Total housing units | 3,457 |
| 1-unit, detached | 2,727 |
| 1-unit, attached | 89 |
| 2 units | 103 |
| 3 or 4 units | 39 |
| 5 to 9 units | 71 |
| 10 to 19 units | 56 |
| 20 or more units | 233 |
| Mobile home | 139 |
| Boat, RV, van, etc. | 0 |
| Total housing units | 3,457 |
| Built 2014 or later | 0 |
| Built 2010 to 2013 | 48 |
| Built 2000 to 2009 | 616 |
| Built 1990 to 1999 | 427 |
| Built 1980 to 1989 | 485 |
| Built 1970 to 1979 | 654 |
| Built 1960 to 1969 | 427 |
| Built 1950 to 1959 | 336 |
| Built 1940 to 1949 | 106 |
| Built 1939 or earlier | 358 |
| Total housing units | 3,457 |
| 1 room | 138 |
| 2 rooms | 26 |
| 3 rooms | 124 |
| 4 rooms | 225 |
| 5 rooms | 445 |
| 6 rooms | 563 |
| 7 rooms | 843 |
| 8 rooms | 553 |
| 9 rooms or more | 540 |
| Median rooms | 6.7 |
| Total housing units | 3,457 |
| No bedroom | 146 |
| 1 bedroom | 175 |
| 2 bedrooms | 456 |
| 3 bedrooms | 1,509 |
| 4 bedrooms | 881 |
| 5 or more bedrooms | 290 |
| Occupied housing units | 3,063 |
| Owner-occupied | 2,636 |
| Renter-occupied | 427 |
| Average household size of owner-occupied unit | 2.81 |
| Average household size of renter-occupied unit | 1.60 |
| Occupied housing units | 3,063 |
| Moved in 2017 or later | 143 |
| Moved in 2015 to 2016 | 295 |
| Moved in 2010 to 2014 | 541 |
| Moved in 2000 to 2009 | 1,004 |
| Moved in 1990 to 1999 | 477 |
| Moved in 1989 and earlier | 603 |
| Owner-occupied units | 2,636 |
| Less than $50,000 | 162 |
| $50,000 to $99,999 | 171 |
| $100,000 to $149,999 | 573 |
| $150,000 to $199,999 | 978 |
| $200,000 to $299,999 | 597 |
| $300,000 to $499,999 | 106 |
| $500,000 to $999,999 | 49 |
| $1,000,000 or more | 0 |
| Median (dollars) | 166,000 |
| Owner-occupied units | 2,636 |
| Housing units with a mortgage | 1,779 |
| Housing units without a mortgage | 857 |
| Occupied units paying rent | 391 |
| Less than $500 | 0 |
| $500 to $999 | 215 |
| $1,000 to $1,499 | 73 |
| $1,500 to $1,999 | 42 |
| $2,000 to $2,499 | 35 |
| $2,500 to $2,999 | 0 |
| $3,000 or more | 26 |
| Median (dollars) | 973 |
| No rent paid | 36 |
Data is based on 2018 Census
ZIP Codes for other locations
State for CRETE
Illinois ZIP CodesOther cities in Illinois