EAST PEORIA, IL ZIP Code
| City | EAST PEORIA |
| State | Illinois |
| ZIP Codes count | 3 (see all) |
| Post offices count | 3 (see all) |
| Total population | 22,876 (see all) |
ZIP Codes in EAST PEORIA, Illinois
61611, 61630, 61635
This list contains only 5-digit ZIP codes. Use our zip code lookup by address feature to get the full 9-digit (ZIP+4) code.
List of EAST PEORIA, IL ZIP Codes
| ZIP | TYPE | POPU |
|---|---|---|
| 61611 | STANDARD | 23,925 |
| 61630 | UNIQUE | – |
| 61635 | UNIQUE | – |
Post offices
EAST PEORIA — Post Office™ 415 E WASHINGTON ST EAST PEORIA, IL 61611-2639 |
EAST PEORIA BRANCH — Post Office™ 401 E WASHINGTON ST EAST PEORIA, IL 61611-2666 |
PEORIA — Post Office™ 95 STATE ST PEORIA, IL 61601-9998 |
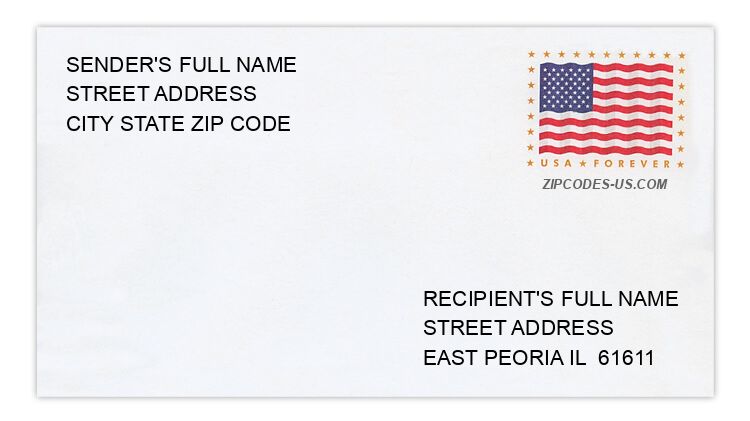
Envelope example
On the bottom center of the envelope, write the address you want your letter delivered to. Include the following on separate lines:
- Recipient's full name
- Full street address
- City, State, and ZIP Code
Using the same format, write the return address in the top left corner.
Using the full ZIP+4 Code when mailing via the USPS ensures the fastest, most accurate mailing possible. If you are not sure of the full 9-digit ZIP Code, use the 5-digit ZIP Code to avoid loss of letter or package.
The recipient address information is provided for your reference.
Address example
123 SCHERTZ AVE
EAST PEORIA IL 61611-2737
EAST PEORIA IL 61611-2737
228 LEXINGTON DR
EAST PEORIA IL 61611-5552
EAST PEORIA IL 61611-5552
134 PATTERSON DR
EAST PEORIA IL 61611-9355
EAST PEORIA IL 61611-9355
273 DUNDEE RD
EAST PEORIA IL 61611-1610
EAST PEORIA IL 61611-1610
449 DUNDEE RD
EAST PEORIA IL 61611-1614
EAST PEORIA IL 61611-1614
358 SCHERTZ AVE
EAST PEORIA IL 61611-27ND
EAST PEORIA IL 61611-27ND
Map
Hover over the map to see the ZIP code
Census data for EAST PEORIA, IL
Demographic and housing estimates in EAST PEORIA, IL
| Total population | 22,876 |
| Male | 11,346 |
| Female | 11,530 |
| Total population | 22,876 |
| Under 5 years | 1,249 |
| 5 to 9 years | 1,156 |
| 10 to 14 years | 1,080 |
| 15 to 19 years | 1,553 |
| 20 to 24 years | 1,022 |
| 25 to 34 years | 3,236 |
| 35 to 44 years | 2,592 |
| 45 to 54 years | 3,244 |
| 55 to 59 years | 1,583 |
| 60 to 64 years | 1,675 |
| 65 to 74 years | 2,452 |
| 75 to 84 years | 1,386 |
| 85 years and over | 648 |
| Median age (years) | 43.0 |
| Under 18 years | 4,236 |
| 16 years and over | 19,095 |
| 18 years and over | 18,640 |
| 21 years and over | 17,595 |
| 62 years and over | 5,458 |
| 65 years and over | 4,486 |
| Total population | 22,876 |
| One race | 22,598 |
| White | 21,374 |
| Black or African American | 622 |
| American Indian and Alaska Native | 16 |
| Asian | 501 |
| Native Hawaiian and Other Pacific Islander | 0 |
| Some other race | 85 |
| Two or more races | 278 |
| Citizen, VOTING AGE 18 and over population | 18,253 |
| Male Citizen, VOTING AGE 18 and over population | 8,915 |
| Female Citizen, VOTING AGE 18 and over population | 9,338 |
Social characteristics in EAST PEORIA, IL
| Total households | 10,046 |
| Family households (families) | 6,236 |
| Married-couple family | 5,047 |
| Male householder, no wife present, family | 347 |
| Female householder, no husband present, family | 842 |
| Nonfamily households | 3,810 |
| Average household size | 2.25 |
| Average family size | 2.77 |
Economic characteristics in EAST PEORIA, IL
| Total households | 10,046 |
| Less than $10,000 | 433 |
| $10,000 to $14,999 | 420 |
| $15,000 to $24,999 | 958 |
| $25,000 to $34,999 | 1,043 |
| $35,000 to $49,999 | 1,674 |
| $50,000 to $74,999 | 1,842 |
| $75,000 to $99,999 | 1,324 |
| $100,000 to $149,999 | 1,736 |
| $150,000 to $199,999 | 349 |
| $200,000 or more | 267 |
| Median household income (dollars) | 56,856 |
Housing characteristics in EAST PEORIA, IL
| Total housing units | 10,888 |
| Occupied housing units | 10,046 |
| Vacant housing units | 842 |
| Total housing units | 10,888 |
| 1-unit, detached | 8,733 |
| 1-unit, attached | 218 |
| 2 units | 221 |
| 3 or 4 units | 270 |
| 5 to 9 units | 358 |
| 10 to 19 units | 355 |
| 20 or more units | 720 |
| Mobile home | 13 |
| Boat, RV, van, etc. | 0 |
| Total housing units | 10,888 |
| Built 2014 or later | 52 |
| Built 2010 to 2013 | 166 |
| Built 2000 to 2009 | 798 |
| Built 1990 to 1999 | 1,165 |
| Built 1980 to 1989 | 864 |
| Built 1970 to 1979 | 1,732 |
| Built 1960 to 1969 | 1,663 |
| Built 1950 to 1959 | 1,903 |
| Built 1940 to 1949 | 1,020 |
| Built 1939 or earlier | 1,525 |
| Total housing units | 10,888 |
| 1 room | 279 |
| 2 rooms | 197 |
| 3 rooms | 1,002 |
| 4 rooms | 1,461 |
| 5 rooms | 2,446 |
| 6 rooms | 2,072 |
| 7 rooms | 1,461 |
| 8 rooms | 994 |
| 9 rooms or more | 976 |
| Median rooms | 5.5 |
| Total housing units | 10,888 |
| No bedroom | 279 |
| 1 bedroom | 1,281 |
| 2 bedrooms | 2,685 |
| 3 bedrooms | 5,269 |
| 4 bedrooms | 1,205 |
| 5 or more bedrooms | 169 |
| Occupied housing units | 10,046 |
| Owner-occupied | 7,323 |
| Renter-occupied | 2,723 |
| Average household size of owner-occupied unit | 2.39 |
| Average household size of renter-occupied unit | 1.88 |
| Occupied housing units | 10,046 |
| Moved in 2017 or later | 437 |
| Moved in 2015 to 2016 | 1,093 |
| Moved in 2010 to 2014 | 2,987 |
| Moved in 2000 to 2009 | 2,314 |
| Moved in 1990 to 1999 | 1,516 |
| Moved in 1989 and earlier | 1,699 |
| Owner-occupied units | 7,323 |
| Less than $50,000 | 315 |
| $50,000 to $99,999 | 1,653 |
| $100,000 to $149,999 | 2,286 |
| $150,000 to $199,999 | 1,890 |
| $200,000 to $299,999 | 855 |
| $300,000 to $499,999 | 251 |
| $500,000 to $999,999 | 53 |
| $1,000,000 or more | 20 |
| Median (dollars) | 136,200 |
| Owner-occupied units | 7,323 |
| Housing units with a mortgage | 4,590 |
| Housing units without a mortgage | 2,733 |
| Occupied units paying rent | 2,597 |
| Less than $500 | 465 |
| $500 to $999 | 1,516 |
| $1,000 to $1,499 | 307 |
| $1,500 to $1,999 | 42 |
| $2,000 to $2,499 | 153 |
| $2,500 to $2,999 | 41 |
| $3,000 or more | 73 |
| Median (dollars) | 689 |
| No rent paid | 126 |
Data is based on 2018 Census
ZIP Codes for other locations
State for EAST PEORIA
Illinois ZIP CodesOther cities in Illinois