FLORA, IL ZIP Code
| City | FLORA |
| State | Illinois |
| ZIP Codes count | 1 (see all) |
| Post offices count | 1 (see all) |
| Total population | 4,842 (see all) |
ZIP Code in FLORA, Illinois
62839
This list contains only 5-digit ZIP codes. Use our zip code lookup by address feature to get the full 9-digit (ZIP+4) code.
List of FLORA, IL ZIP Codes
| ZIP | TYPE | POPU |
|---|---|---|
| 62839 | STANDARD | 6,418 |
Post offices
FLORA — Post Office™ 312 E NORTH AVE FLORA, IL 62839-9998 |
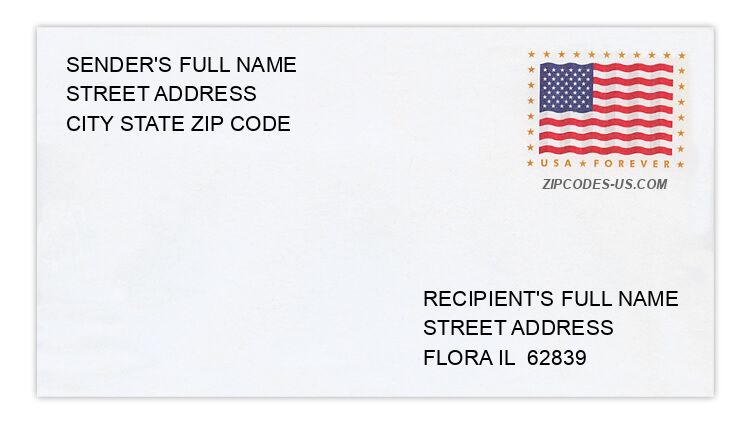
Envelope example
On the bottom center of the envelope, write the address you want your letter delivered to. Include the following on separate lines:
- Recipient's full name
- Full street address
- City, State, and ZIP Code
Using the same format, write the return address in the top left corner.
Using the full ZIP+4 Code when mailing via the USPS ensures the fastest, most accurate mailing possible. If you are not sure of the full 9-digit ZIP Code, use the 5-digit ZIP Code to avoid loss of letter or package.
The recipient address information is provided for your reference.
Address example
120 E 8TH ST
FLORA IL 62839-1806
FLORA IL 62839-1806
2580 KNEFF CEMETERY LN
FLORA IL 62839-3700
FLORA IL 62839-3700
2994 PALM LN
FLORA IL 62839-3089
FLORA IL 62839-3089
889 S LOCUST ST
FLORA IL 62839-2242
FLORA IL 62839-2242
226 SHAYLEE DR
FLORA IL 62839-4176
FLORA IL 62839-4176
23 SWEET BIRCH DR
FLORA IL 62839-3360
FLORA IL 62839-3360
Map
Hover over the map to see the ZIP code
Census data for FLORA, IL
Demographic and housing estimates in FLORA, IL
| Total population | 4,842 |
| Male | 2,173 |
| Female | 2,669 |
| Total population | 4,842 |
| Under 5 years | 262 |
| 5 to 9 years | 326 |
| 10 to 14 years | 272 |
| 15 to 19 years | 351 |
| 20 to 24 years | 272 |
| 25 to 34 years | 434 |
| 35 to 44 years | 650 |
| 45 to 54 years | 608 |
| 55 to 59 years | 293 |
| 60 to 64 years | 389 |
| 65 to 74 years | 566 |
| 75 to 84 years | 254 |
| 85 years and over | 165 |
| Median age (years) | 41.4 |
| Under 18 years | 1,075 |
| 16 years and over | 3,886 |
| 18 years and over | 3,767 |
| 21 years and over | 3,613 |
| 62 years and over | 1,159 |
| 65 years and over | 985 |
| Total population | 4,842 |
| One race | 4,684 |
| White | 4,647 |
| Black or African American | 22 |
| American Indian and Alaska Native | 12 |
| Asian | 3 |
| Native Hawaiian and Other Pacific Islander | 0 |
| Some other race | 0 |
| Two or more races | 158 |
| Citizen, VOTING AGE 18 and over population | 3,767 |
| Male Citizen, VOTING AGE 18 and over population | 1,658 |
| Female Citizen, VOTING AGE 18 and over population | 2,109 |
Social characteristics in FLORA, IL
| Total households | 2,078 |
| Family households (families) | 1,213 |
| Married-couple family | 764 |
| Male householder, no wife present, family | 185 |
| Female householder, no husband present, family | 264 |
| Nonfamily households | 865 |
| Average household size | 2.23 |
| Average family size | 2.74 |
Economic characteristics in FLORA, IL
| Total households | 2,078 |
| Less than $10,000 | 180 |
| $10,000 to $14,999 | 206 |
| $15,000 to $24,999 | 337 |
| $25,000 to $34,999 | 109 |
| $35,000 to $49,999 | 362 |
| $50,000 to $74,999 | 349 |
| $75,000 to $99,999 | 202 |
| $100,000 to $149,999 | 219 |
| $150,000 to $199,999 | 78 |
| $200,000 or more | 36 |
| Median household income (dollars) | 41,192 |
Housing characteristics in FLORA, IL
| Total housing units | 2,344 |
| Occupied housing units | 2,078 |
| Vacant housing units | 266 |
| Total housing units | 2,344 |
| 1-unit, detached | 1,725 |
| 1-unit, attached | 40 |
| 2 units | 18 |
| 3 or 4 units | 107 |
| 5 to 9 units | 108 |
| 10 to 19 units | 19 |
| 20 or more units | 25 |
| Mobile home | 302 |
| Boat, RV, van, etc. | 0 |
| Total housing units | 2,344 |
| Built 2014 or later | 0 |
| Built 2010 to 2013 | 37 |
| Built 2000 to 2009 | 171 |
| Built 1990 to 1999 | 241 |
| Built 1980 to 1989 | 86 |
| Built 1970 to 1979 | 333 |
| Built 1960 to 1969 | 245 |
| Built 1950 to 1959 | 604 |
| Built 1940 to 1949 | 228 |
| Built 1939 or earlier | 399 |
| Total housing units | 2,344 |
| 1 room | 34 |
| 2 rooms | 37 |
| 3 rooms | 91 |
| 4 rooms | 325 |
| 5 rooms | 618 |
| 6 rooms | 446 |
| 7 rooms | 344 |
| 8 rooms | 179 |
| 9 rooms or more | 270 |
| Median rooms | 5.7 |
| Total housing units | 2,344 |
| No bedroom | 34 |
| 1 bedroom | 159 |
| 2 bedrooms | 693 |
| 3 bedrooms | 1,030 |
| 4 bedrooms | 195 |
| 5 or more bedrooms | 233 |
| Occupied housing units | 2,078 |
| Owner-occupied | 1,360 |
| Renter-occupied | 718 |
| Average household size of owner-occupied unit | 2.29 |
| Average household size of renter-occupied unit | 2.10 |
| Occupied housing units | 2,078 |
| Moved in 2017 or later | 137 |
| Moved in 2015 to 2016 | 97 |
| Moved in 2010 to 2014 | 713 |
| Moved in 2000 to 2009 | 563 |
| Moved in 1990 to 1999 | 184 |
| Moved in 1989 and earlier | 384 |
| Owner-occupied units | 1,360 |
| Less than $50,000 | 221 |
| $50,000 to $99,999 | 751 |
| $100,000 to $149,999 | 238 |
| $150,000 to $199,999 | 94 |
| $200,000 to $299,999 | 16 |
| $300,000 to $499,999 | 17 |
| $500,000 to $999,999 | 0 |
| $1,000,000 or more | 23 |
| Median (dollars) | 76,300 |
| Owner-occupied units | 1,360 |
| Housing units with a mortgage | 883 |
| Housing units without a mortgage | 477 |
| Occupied units paying rent | 645 |
| Less than $500 | 240 |
| $500 to $999 | 385 |
| $1,000 to $1,499 | 0 |
| $1,500 to $1,999 | 0 |
| $2,000 to $2,499 | 0 |
| $2,500 to $2,999 | 0 |
| $3,000 or more | 20 |
| Median (dollars) | 576 |
| No rent paid | 73 |
Data is based on 2018 Census
ZIP Codes for other locations
State for FLORA
Illinois ZIP CodesOther cities in Illinois