GALVA, IL ZIP Code
| City | GALVA |
| State | Illinois |
| ZIP Codes count | 1 (see all) |
| Post offices count | 1 (see all) |
| Total population | 2,565 (see all) |
ZIP Code in GALVA, Illinois
61434
This list contains only 5-digit ZIP codes. Use our zip code lookup by address feature to get the full 9-digit (ZIP+4) code.
List of GALVA, IL ZIP Codes
| ZIP | TYPE | POPU |
|---|---|---|
| 61434 | STANDARD | 2,816 |
Post offices
GALVA — Post Office™ 116 EXCHANGE ST GALVA, IL 61434-9800 |
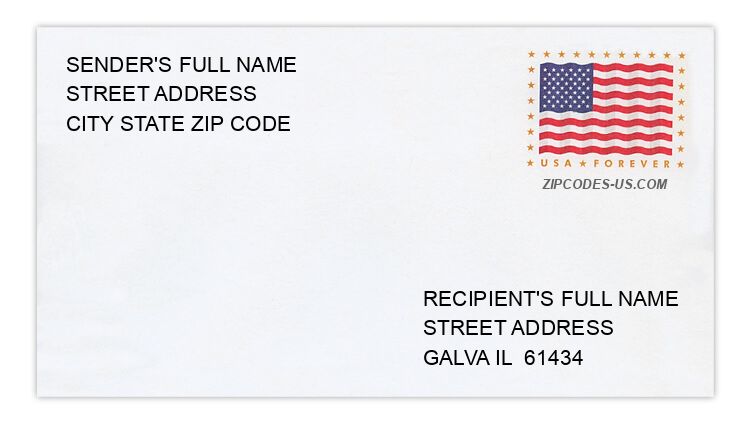
Envelope example
On the bottom center of the envelope, write the address you want your letter delivered to. Include the following on separate lines:
- Recipient's full name
- Full street address
- City, State, and ZIP Code
Using the same format, write the return address in the top left corner.
Using the full ZIP+4 Code when mailing via the USPS ensures the fastest, most accurate mailing possible. If you are not sure of the full 9-digit ZIP Code, use the 5-digit ZIP Code to avoid loss of letter or package.
The recipient address information is provided for your reference.
Address example
2088 KNOX HIGHWAY 4
GALVA IL 61434-9567
GALVA IL 61434-9567
2510 KNOX ROAD 2170 E
GALVA IL 61434-9557
GALVA IL 61434-9557
1023 MIDLAND RD
GALVA IL 61434-9158
GALVA IL 61434-9158
540 NW 10TH ST
GALVA IL 61434-1070
GALVA IL 61434-1070
1103 NW 5TH AVE
GALVA IL 61434-1046
GALVA IL 61434-1046
163 SE 1ST AVE
GALVA IL 61434-1779
GALVA IL 61434-1779
Map
Hover over the map to see the ZIP code
Census data for GALVA, IL
Demographic and housing estimates in GALVA, IL
| Total population | 2,565 |
| Male | 1,307 |
| Female | 1,258 |
| Total population | 2,565 |
| Under 5 years | 80 |
| 5 to 9 years | 98 |
| 10 to 14 years | 248 |
| 15 to 19 years | 155 |
| 20 to 24 years | 135 |
| 25 to 34 years | 260 |
| 35 to 44 years | 330 |
| 45 to 54 years | 346 |
| 55 to 59 years | 190 |
| 60 to 64 years | 177 |
| 65 to 74 years | 326 |
| 75 to 84 years | 159 |
| 85 years and over | 61 |
| Median age (years) | 44.3 |
| Under 18 years | 530 |
| 16 years and over | 2,117 |
| 18 years and over | 2,035 |
| 21 years and over | 1,931 |
| 62 years and over | 658 |
| 65 years and over | 546 |
| Total population | 2,565 |
| One race | 2,517 |
| White | 2,477 |
| Black or African American | 0 |
| American Indian and Alaska Native | 0 |
| Asian | 12 |
| Native Hawaiian and Other Pacific Islander | 0 |
| Some other race | 28 |
| Two or more races | 48 |
| Citizen, VOTING AGE 18 and over population | 2,007 |
| Male Citizen, VOTING AGE 18 and over population | 1,018 |
| Female Citizen, VOTING AGE 18 and over population | 989 |
Social characteristics in GALVA, IL
| Total households | 1,157 |
| Family households (families) | 738 |
| Married-couple family | 558 |
| Male householder, no wife present, family | 34 |
| Female householder, no husband present, family | 146 |
| Nonfamily households | 419 |
| Average household size | 2.22 |
| Average family size | 2.81 |
Economic characteristics in GALVA, IL
| Total households | 1,157 |
| Less than $10,000 | 84 |
| $10,000 to $14,999 | 100 |
| $15,000 to $24,999 | 201 |
| $25,000 to $34,999 | 127 |
| $35,000 to $49,999 | 173 |
| $50,000 to $74,999 | 198 |
| $75,000 to $99,999 | 90 |
| $100,000 to $149,999 | 140 |
| $150,000 to $199,999 | 38 |
| $200,000 or more | 6 |
| Median household income (dollars) | 39,258 |
Housing characteristics in GALVA, IL
| Total housing units | 1,299 |
| Occupied housing units | 1,157 |
| Vacant housing units | 142 |
| Total housing units | 1,299 |
| 1-unit, detached | 1,025 |
| 1-unit, attached | 20 |
| 2 units | 56 |
| 3 or 4 units | 30 |
| 5 to 9 units | 11 |
| 10 to 19 units | 0 |
| 20 or more units | 114 |
| Mobile home | 43 |
| Boat, RV, van, etc. | 0 |
| Total housing units | 1,299 |
| Built 2014 or later | 0 |
| Built 2010 to 2013 | 0 |
| Built 2000 to 2009 | 36 |
| Built 1990 to 1999 | 25 |
| Built 1980 to 1989 | 84 |
| Built 1970 to 1979 | 220 |
| Built 1960 to 1969 | 155 |
| Built 1950 to 1959 | 124 |
| Built 1940 to 1949 | 57 |
| Built 1939 or earlier | 598 |
| Total housing units | 1,299 |
| 1 room | 69 |
| 2 rooms | 4 |
| 3 rooms | 55 |
| 4 rooms | 91 |
| 5 rooms | 202 |
| 6 rooms | 315 |
| 7 rooms | 247 |
| 8 rooms | 110 |
| 9 rooms or more | 206 |
| Median rooms | 6.2 |
| Total housing units | 1,299 |
| No bedroom | 73 |
| 1 bedroom | 55 |
| 2 bedrooms | 347 |
| 3 bedrooms | 527 |
| 4 bedrooms | 237 |
| 5 or more bedrooms | 60 |
| Occupied housing units | 1,157 |
| Owner-occupied | 877 |
| Renter-occupied | 280 |
| Average household size of owner-occupied unit | 2.20 |
| Average household size of renter-occupied unit | 2.28 |
| Occupied housing units | 1,157 |
| Moved in 2017 or later | 26 |
| Moved in 2015 to 2016 | 102 |
| Moved in 2010 to 2014 | 255 |
| Moved in 2000 to 2009 | 327 |
| Moved in 1990 to 1999 | 215 |
| Moved in 1989 and earlier | 232 |
| Owner-occupied units | 877 |
| Less than $50,000 | 230 |
| $50,000 to $99,999 | 428 |
| $100,000 to $149,999 | 110 |
| $150,000 to $199,999 | 76 |
| $200,000 to $299,999 | 33 |
| $300,000 to $499,999 | 0 |
| $500,000 to $999,999 | 0 |
| $1,000,000 or more | 0 |
| Median (dollars) | 72,600 |
| Owner-occupied units | 877 |
| Housing units with a mortgage | 411 |
| Housing units without a mortgage | 466 |
| Occupied units paying rent | 263 |
| Less than $500 | 115 |
| $500 to $999 | 138 |
| $1,000 to $1,499 | 10 |
| $1,500 to $1,999 | 0 |
| $2,000 to $2,499 | 0 |
| $2,500 to $2,999 | 0 |
| $3,000 or more | 0 |
| Median (dollars) | 570 |
| No rent paid | 17 |
Data is based on 2018 Census
ZIP Codes for other locations
State for GALVA
Illinois ZIP CodesOther cities in Illinois