GRAYVILLE, IL ZIP Code
| City | GRAYVILLE |
| State | Illinois |
| ZIP Codes count | 1 (see all) |
| Post offices count | 1 (see all) |
| Total population | 1,728 (see all) |
ZIP Code in GRAYVILLE, Illinois
62844
This list contains only 5-digit ZIP codes. Use our zip code lookup by address feature to get the full 9-digit (ZIP+4) code.
List of GRAYVILLE, IL ZIP Codes
| ZIP | TYPE | POPU |
|---|---|---|
| 62844 | STANDARD | 2,015 |
Post offices
GRAYVILLE — Post Office™ 210 E SOUTH ST GRAYVILLE, IL 62844-9997 |
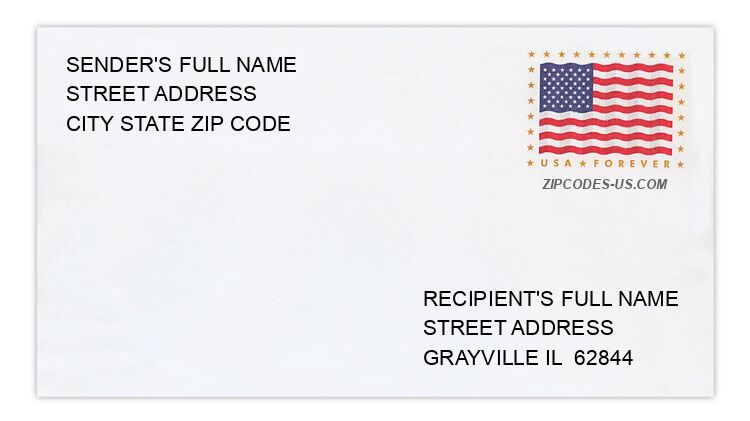
Envelope example
On the bottom center of the envelope, write the address you want your letter delivered to. Include the following on separate lines:
- Recipient's full name
- Full street address
- City, State, and ZIP Code
Using the same format, write the return address in the top left corner.
Using the full ZIP+4 Code when mailing via the USPS ensures the fastest, most accurate mailing possible. If you are not sure of the full 9-digit ZIP Code, use the 5-digit ZIP Code to avoid loss of letter or package.
The recipient address information is provided for your reference.
Address example
2105 COUNTY ROAD 2300 N
GRAYVILLE IL 62844-3233
GRAYVILLE IL 62844-3233
2177 COUNTY ROAD 2450 N
GRAYVILLE IL 62844-3401
GRAYVILLE IL 62844-3401
58 COUNTY ROAD 400 E
GRAYVILLE IL 62844-3251
GRAYVILLE IL 62844-3251
2355 HIGHWAY 1
GRAYVILLE IL 62844-4202
GRAYVILLE IL 62844-4202
150 N 5TH ST
GRAYVILLE IL 62844-1307
GRAYVILLE IL 62844-1307
399 W PLUM ST
GRAYVILLE IL 62844-1234
GRAYVILLE IL 62844-1234
Map
Hover over the map to see the ZIP code
Census data for GRAYVILLE, IL
Demographic and housing estimates in GRAYVILLE, IL
| Total population | 1,728 |
| Male | 855 |
| Female | 873 |
| Total population | 1,728 |
| Under 5 years | 172 |
| 5 to 9 years | 89 |
| 10 to 14 years | 114 |
| 15 to 19 years | 95 |
| 20 to 24 years | 100 |
| 25 to 34 years | 242 |
| 35 to 44 years | 176 |
| 45 to 54 years | 179 |
| 55 to 59 years | 117 |
| 60 to 64 years | 63 |
| 65 to 74 years | 203 |
| 75 to 84 years | 101 |
| 85 years and over | 77 |
| Median age (years) | 37.0 |
| Under 18 years | 434 |
| 16 years and over | 1,342 |
| 18 years and over | 1,294 |
| 21 years and over | 1,246 |
| 62 years and over | 411 |
| 65 years and over | 381 |
| Total population | 1,728 |
| One race | 1,698 |
| White | 1,686 |
| Black or African American | 11 |
| American Indian and Alaska Native | 0 |
| Asian | 1 |
| Native Hawaiian and Other Pacific Islander | 0 |
| Some other race | 0 |
| Two or more races | 30 |
| Citizen, VOTING AGE 18 and over population | 1,294 |
| Male Citizen, VOTING AGE 18 and over population | 612 |
| Female Citizen, VOTING AGE 18 and over population | 682 |
Social characteristics in GRAYVILLE, IL
| Total households | 704 |
| Family households (families) | 419 |
| Married-couple family | 342 |
| Male householder, no wife present, family | 14 |
| Female householder, no husband present, family | 63 |
| Nonfamily households | 285 |
| Average household size | 2.38 |
| Average family size | 3.00 |
Economic characteristics in GRAYVILLE, IL
| Total households | 704 |
| Less than $10,000 | 62 |
| $10,000 to $14,999 | 23 |
| $15,000 to $24,999 | 108 |
| $25,000 to $34,999 | 104 |
| $35,000 to $49,999 | 95 |
| $50,000 to $74,999 | 122 |
| $75,000 to $99,999 | 104 |
| $100,000 to $149,999 | 67 |
| $150,000 to $199,999 | 9 |
| $200,000 or more | 10 |
| Median household income (dollars) | 42,857 |
Housing characteristics in GRAYVILLE, IL
| Total housing units | 876 |
| Occupied housing units | 704 |
| Vacant housing units | 172 |
| Total housing units | 876 |
| 1-unit, detached | 650 |
| 1-unit, attached | 8 |
| 2 units | 50 |
| 3 or 4 units | 38 |
| 5 to 9 units | 14 |
| 10 to 19 units | 7 |
| 20 or more units | 0 |
| Mobile home | 109 |
| Boat, RV, van, etc. | 0 |
| Total housing units | 876 |
| Built 2014 or later | 6 |
| Built 2010 to 2013 | 6 |
| Built 2000 to 2009 | 54 |
| Built 1990 to 1999 | 69 |
| Built 1980 to 1989 | 51 |
| Built 1970 to 1979 | 108 |
| Built 1960 to 1969 | 64 |
| Built 1950 to 1959 | 144 |
| Built 1940 to 1949 | 114 |
| Built 1939 or earlier | 260 |
| Total housing units | 876 |
| 1 room | 10 |
| 2 rooms | 4 |
| 3 rooms | 42 |
| 4 rooms | 176 |
| 5 rooms | 246 |
| 6 rooms | 154 |
| 7 rooms | 117 |
| 8 rooms | 74 |
| 9 rooms or more | 53 |
| Median rooms | 5.3 |
| Total housing units | 876 |
| No bedroom | 14 |
| 1 bedroom | 82 |
| 2 bedrooms | 298 |
| 3 bedrooms | 396 |
| 4 bedrooms | 86 |
| 5 or more bedrooms | 0 |
| Occupied housing units | 704 |
| Owner-occupied | 555 |
| Renter-occupied | 149 |
| Average household size of owner-occupied unit | 2.32 |
| Average household size of renter-occupied unit | 2.60 |
| Occupied housing units | 704 |
| Moved in 2017 or later | 41 |
| Moved in 2015 to 2016 | 76 |
| Moved in 2010 to 2014 | 154 |
| Moved in 2000 to 2009 | 144 |
| Moved in 1990 to 1999 | 128 |
| Moved in 1989 and earlier | 161 |
| Owner-occupied units | 555 |
| Less than $50,000 | 184 |
| $50,000 to $99,999 | 306 |
| $100,000 to $149,999 | 37 |
| $150,000 to $199,999 | 24 |
| $200,000 to $299,999 | 4 |
| $300,000 to $499,999 | 0 |
| $500,000 to $999,999 | 0 |
| $1,000,000 or more | 0 |
| Median (dollars) | 62,500 |
| Owner-occupied units | 555 |
| Housing units with a mortgage | 273 |
| Housing units without a mortgage | 282 |
| Occupied units paying rent | 119 |
| Less than $500 | 87 |
| $500 to $999 | 32 |
| $1,000 to $1,499 | 0 |
| $1,500 to $1,999 | 0 |
| $2,000 to $2,499 | 0 |
| $2,500 to $2,999 | 0 |
| $3,000 or more | 0 |
| Median (dollars) | 410 |
| No rent paid | 30 |
Data is based on 2018 Census
ZIP Codes for other locations
State for GRAYVILLE
Illinois ZIP CodesOther cities in Illinois