HAMPSHIRE, IL ZIP Code
| City | HAMPSHIRE |
| State | Illinois |
| ZIP Codes count | 1 (see all) |
| Post offices count | 1 (see all) |
| Total population | 5,852 (see all) |
ZIP Code in HAMPSHIRE, Illinois
60140
This list contains only 5-digit ZIP codes. Use our zip code lookup by address feature to get the full 9-digit (ZIP+4) code.
List of HAMPSHIRE, IL ZIP Codes
| ZIP | TYPE | POPU |
|---|---|---|
| 60140 | STANDARD | 20,859 |
Post offices
HAMPSHIRE — Post Office™ 196 WASHINGTON AVE HAMPSHIRE, IL 60140-1000 |
Envelope example
On the bottom center of the envelope, write the address you want your letter delivered to. Include the following on separate lines:
- Recipient's full name
- Full street address
- City, State, and ZIP Code
Using the same format, write the return address in the top left corner.
Using the full ZIP+4 Code when mailing via the USPS ensures the fastest, most accurate mailing possible. If you are not sure of the full 9-digit ZIP Code, use the 5-digit ZIP Code to avoid loss of letter or package.
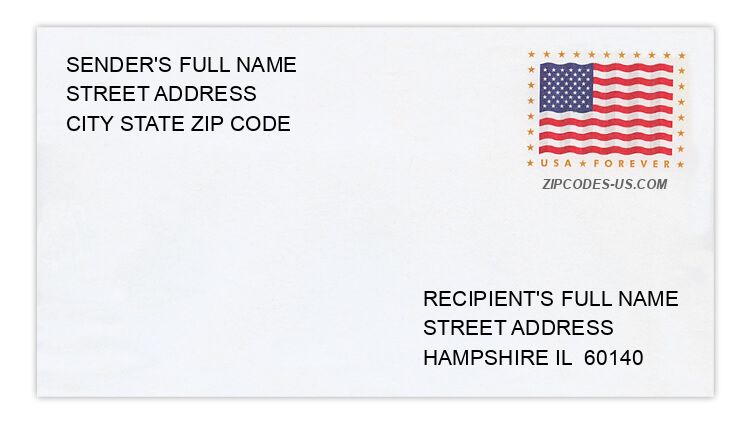
The recipient address information is provided for your reference.
Address example
172 W JEFFERSON ST
HAMPSHIRE IL 60140-7014
HAMPSHIRE IL 60140-7014
388 ELM ST
HAMPSHIRE IL 60140-7012
HAMPSHIRE IL 60140-7012
278 STANLEY DR
HAMPSHIRE IL 60140-9468
HAMPSHIRE IL 60140-9468
139 ELM ST
HAMPSHIRE IL 60140-7002
HAMPSHIRE IL 60140-7002
694 ELM ST
HAMPSHIRE IL 60140-8371
HAMPSHIRE IL 60140-8371
204 STANLEY DR
HAMPSHIRE IL 60140-9468
HAMPSHIRE IL 60140-9468
Map
Hover over the map to see the ZIP code
Census data for HAMPSHIRE, IL
Demographic and housing estimates in HAMPSHIRE, IL
| Total population | 5,852 |
| Male | 2,930 |
| Female | 2,922 |
| Total population | 5,852 |
| Under 5 years | 446 |
| 5 to 9 years | 366 |
| 10 to 14 years | 827 |
| 15 to 19 years | 448 |
| 20 to 24 years | 474 |
| 25 to 34 years | 401 |
| 35 to 44 years | 1,025 |
| 45 to 54 years | 1,038 |
| 55 to 59 years | 415 |
| 60 to 64 years | 222 |
| 65 to 74 years | 58 |
| 75 to 84 years | 132 |
| 85 years and over | 0 |
| Median age (years) | 32.3 |
| Under 18 years | 1,852 |
| 16 years and over | 4,213 |
| 18 years and over | 4,000 |
| 21 years and over | 3,450 |
| 62 years and over | 324 |
| 65 years and over | 190 |
| Total population | 5,852 |
| One race | 5,852 |
| White | 5,769 |
| Black or African American | 0 |
| American Indian and Alaska Native | 0 |
| Asian | 83 |
| Native Hawaiian and Other Pacific Islander | 0 |
| Some other race | 0 |
| Two or more races | 0 |
| Citizen, VOTING AGE 18 and over population | 4,000 |
| Male Citizen, VOTING AGE 18 and over population | 1,876 |
| Female Citizen, VOTING AGE 18 and over population | 2,124 |
Social characteristics in HAMPSHIRE, IL
| Total households | 1,733 |
| Family households (families) | 1,411 |
| Married-couple family | 1,130 |
| Male householder, no wife present, family | 92 |
| Female householder, no husband present, family | 189 |
| Nonfamily households | 322 |
| Average household size | 3.38 |
| Average family size | 3.53 |
Economic characteristics in HAMPSHIRE, IL
| Total households | 1,733 |
| Less than $10,000 | 0 |
| $10,000 to $14,999 | 0 |
| $15,000 to $24,999 | 23 |
| $25,000 to $34,999 | 133 |
| $35,000 to $49,999 | 93 |
| $50,000 to $74,999 | 343 |
| $75,000 to $99,999 | 82 |
| $100,000 to $149,999 | 585 |
| $150,000 to $199,999 | 385 |
| $200,000 or more | 89 |
| Median household income (dollars) | 102,418 |
Housing characteristics in HAMPSHIRE, IL
| Total housing units | 1,844 |
| Occupied housing units | 1,733 |
| Vacant housing units | 111 |
| Total housing units | 1,844 |
| 1-unit, detached | 1,123 |
| 1-unit, attached | 545 |
| 2 units | 91 |
| 3 or 4 units | 62 |
| 5 to 9 units | 23 |
| 10 to 19 units | 0 |
| 20 or more units | 0 |
| Mobile home | 0 |
| Boat, RV, van, etc. | 0 |
| Total housing units | 1,844 |
| Built 2014 or later | 86 |
| Built 2010 to 2013 | 174 |
| Built 2000 to 2009 | 439 |
| Built 1990 to 1999 | 410 |
| Built 1980 to 1989 | 79 |
| Built 1970 to 1979 | 254 |
| Built 1960 to 1969 | 207 |
| Built 1950 to 1959 | 30 |
| Built 1940 to 1949 | 23 |
| Built 1939 or earlier | 142 |
| Total housing units | 1,844 |
| 1 room | 0 |
| 2 rooms | 0 |
| 3 rooms | 32 |
| 4 rooms | 28 |
| 5 rooms | 512 |
| 6 rooms | 364 |
| 7 rooms | 400 |
| 8 rooms | 212 |
| 9 rooms or more | 296 |
| Median rooms | 6.5 |
| Total housing units | 1,844 |
| No bedroom | 0 |
| 1 bedroom | 0 |
| 2 bedrooms | 214 |
| 3 bedrooms | 1,081 |
| 4 bedrooms | 392 |
| 5 or more bedrooms | 157 |
| Occupied housing units | 1,733 |
| Owner-occupied | 1,565 |
| Renter-occupied | 168 |
| Average household size of owner-occupied unit | 3.50 |
| Average household size of renter-occupied unit | 2.20 |
| Occupied housing units | 1,733 |
| Moved in 2017 or later | 77 |
| Moved in 2015 to 2016 | 95 |
| Moved in 2010 to 2014 | 374 |
| Moved in 2000 to 2009 | 919 |
| Moved in 1990 to 1999 | 208 |
| Moved in 1989 and earlier | 60 |
| Owner-occupied units | 1,565 |
| Less than $50,000 | 66 |
| $50,000 to $99,999 | 57 |
| $100,000 to $149,999 | 208 |
| $150,000 to $199,999 | 527 |
| $200,000 to $299,999 | 486 |
| $300,000 to $499,999 | 221 |
| $500,000 to $999,999 | 0 |
| $1,000,000 or more | 0 |
| Median (dollars) | 194,400 |
| Owner-occupied units | 1,565 |
| Housing units with a mortgage | 1,253 |
| Housing units without a mortgage | 312 |
| Occupied units paying rent | 168 |
| Less than $500 | 0 |
| $500 to $999 | 28 |
| $1,000 to $1,499 | 93 |
| $1,500 to $1,999 | 47 |
| $2,000 to $2,499 | 0 |
| $2,500 to $2,999 | 0 |
| $3,000 or more | 0 |
| Median (dollars) | 1,233 |
| No rent paid | 0 |
Data is based on 2018 Census
ZIP Codes for other locations
State for HAMPSHIRE
Illinois ZIP CodesOther cities in Illinois