HEYWORTH, IL ZIP Code
| City | HEYWORTH |
| State | Illinois |
| ZIP Codes count | 1 (see all) |
| Post offices count | 1 (see all) |
| Total population | 3,164 (see all) |
ZIP Code in HEYWORTH, Illinois
61745
This list contains only 5-digit ZIP codes. Use our zip code lookup by address feature to get the full 9-digit (ZIP+4) code.
List of HEYWORTH, IL ZIP Codes
| ZIP | TYPE | POPU |
|---|---|---|
| 61745 | STANDARD | 4,729 |
Post offices
HEYWORTH — Post Office™ 102 S WILLIS ST HEYWORTH, IL 61745-9900 |
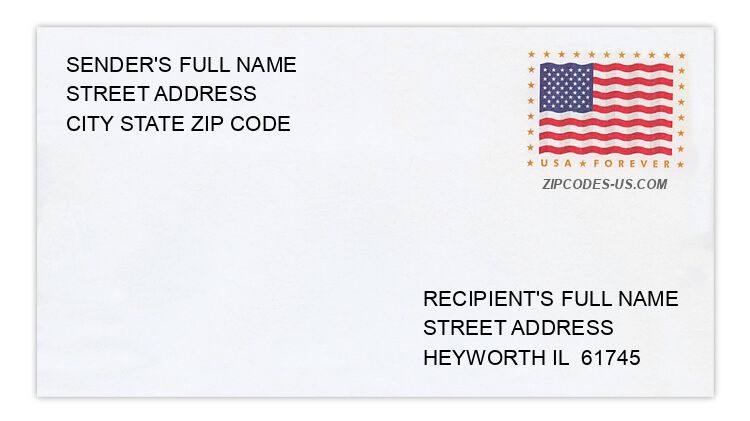
Envelope example
On the bottom center of the envelope, write the address you want your letter delivered to. Include the following on separate lines:
- Recipient's full name
- Full street address
- City, State, and ZIP Code
Using the same format, write the return address in the top left corner.
Using the full ZIP+4 Code when mailing via the USPS ensures the fastest, most accurate mailing possible. If you are not sure of the full 9-digit ZIP Code, use the 5-digit ZIP Code to avoid loss of letter or package.
The recipient address information is provided for your reference.
Address example
99 CLAFLIN CT
HEYWORTH IL 61745-9219
HEYWORTH IL 61745-9219
5417 COLUMBIA RD
HEYWORTH IL 61745-8843
HEYWORTH IL 61745-8843
17728 E 575 NORTH RD
HEYWORTH IL 61745-9055
HEYWORTH IL 61745-9055
2605 N 1500 EAST RD
HEYWORTH IL 61745-7632
HEYWORTH IL 61745-7632
1280 N 1800 EAST RD
HEYWORTH IL 61745-7544
HEYWORTH IL 61745-7544
168 W CLARKE ST
HEYWORTH IL 61745-7660
HEYWORTH IL 61745-7660
Map
Hover over the map to see the ZIP code
Census data for HEYWORTH, IL
Demographic and housing estimates in HEYWORTH, IL
| Total population | 3,164 |
| Male | 1,558 |
| Female | 1,606 |
| Total population | 3,164 |
| Under 5 years | 160 |
| 5 to 9 years | 264 |
| 10 to 14 years | 235 |
| 15 to 19 years | 307 |
| 20 to 24 years | 154 |
| 25 to 34 years | 348 |
| 35 to 44 years | 427 |
| 45 to 54 years | 527 |
| 55 to 59 years | 230 |
| 60 to 64 years | 159 |
| 65 to 74 years | 224 |
| 75 to 84 years | 84 |
| 85 years and over | 45 |
| Median age (years) | 38.2 |
| Under 18 years | 857 |
| 16 years and over | 2,432 |
| 18 years and over | 2,307 |
| 21 years and over | 2,159 |
| 62 years and over | 430 |
| 65 years and over | 353 |
| Total population | 3,164 |
| One race | 3,089 |
| White | 3,056 |
| Black or African American | 20 |
| American Indian and Alaska Native | 0 |
| Asian | 6 |
| Native Hawaiian and Other Pacific Islander | 0 |
| Some other race | 7 |
| Two or more races | 75 |
| Citizen, VOTING AGE 18 and over population | 2,307 |
| Male Citizen, VOTING AGE 18 and over population | 1,076 |
| Female Citizen, VOTING AGE 18 and over population | 1,231 |
Social characteristics in HEYWORTH, IL
| Total households | 1,153 |
| Family households (families) | 807 |
| Married-couple family | 625 |
| Male householder, no wife present, family | 43 |
| Female householder, no husband present, family | 139 |
| Nonfamily households | 346 |
| Average household size | 2.74 |
| Average family size | 3.29 |
Economic characteristics in HEYWORTH, IL
| Total households | 1,153 |
| Less than $10,000 | 115 |
| $10,000 to $14,999 | 31 |
| $15,000 to $24,999 | 113 |
| $25,000 to $34,999 | 65 |
| $35,000 to $49,999 | 87 |
| $50,000 to $74,999 | 199 |
| $75,000 to $99,999 | 147 |
| $100,000 to $149,999 | 245 |
| $150,000 to $199,999 | 108 |
| $200,000 or more | 43 |
| Median household income (dollars) | 69,476 |
Housing characteristics in HEYWORTH, IL
| Total housing units | 1,212 |
| Occupied housing units | 1,153 |
| Vacant housing units | 59 |
| Total housing units | 1,212 |
| 1-unit, detached | 958 |
| 1-unit, attached | 18 |
| 2 units | 87 |
| 3 or 4 units | 73 |
| 5 to 9 units | 5 |
| 10 to 19 units | 0 |
| 20 or more units | 0 |
| Mobile home | 67 |
| Boat, RV, van, etc. | 4 |
| Total housing units | 1,212 |
| Built 2014 or later | 9 |
| Built 2010 to 2013 | 40 |
| Built 2000 to 2009 | 109 |
| Built 1990 to 1999 | 285 |
| Built 1980 to 1989 | 91 |
| Built 1970 to 1979 | 170 |
| Built 1960 to 1969 | 83 |
| Built 1950 to 1959 | 171 |
| Built 1940 to 1949 | 26 |
| Built 1939 or earlier | 228 |
| Total housing units | 1,212 |
| 1 room | 9 |
| 2 rooms | 20 |
| 3 rooms | 62 |
| 4 rooms | 123 |
| 5 rooms | 212 |
| 6 rooms | 189 |
| 7 rooms | 231 |
| 8 rooms | 151 |
| 9 rooms or more | 215 |
| Median rooms | 6.5 |
| Total housing units | 1,212 |
| No bedroom | 9 |
| 1 bedroom | 73 |
| 2 bedrooms | 292 |
| 3 bedrooms | 463 |
| 4 bedrooms | 323 |
| 5 or more bedrooms | 52 |
| Occupied housing units | 1,153 |
| Owner-occupied | 874 |
| Renter-occupied | 279 |
| Average household size of owner-occupied unit | 2.86 |
| Average household size of renter-occupied unit | 2.37 |
| Occupied housing units | 1,153 |
| Moved in 2017 or later | 67 |
| Moved in 2015 to 2016 | 157 |
| Moved in 2010 to 2014 | 262 |
| Moved in 2000 to 2009 | 340 |
| Moved in 1990 to 1999 | 193 |
| Moved in 1989 and earlier | 134 |
| Owner-occupied units | 874 |
| Less than $50,000 | 51 |
| $50,000 to $99,999 | 108 |
| $100,000 to $149,999 | 252 |
| $150,000 to $199,999 | 225 |
| $200,000 to $299,999 | 185 |
| $300,000 to $499,999 | 31 |
| $500,000 to $999,999 | 22 |
| $1,000,000 or more | 0 |
| Median (dollars) | 154,900 |
| Owner-occupied units | 874 |
| Housing units with a mortgage | 531 |
| Housing units without a mortgage | 343 |
| Occupied units paying rent | 257 |
| Less than $500 | 36 |
| $500 to $999 | 133 |
| $1,000 to $1,499 | 85 |
| $1,500 to $1,999 | 3 |
| $2,000 to $2,499 | 0 |
| $2,500 to $2,999 | 0 |
| $3,000 or more | 0 |
| Median (dollars) | 770 |
| No rent paid | 22 |
Data is based on 2018 Census
ZIP Codes for other locations
State for HEYWORTH
Illinois ZIP CodesOther cities in Illinois