HUNTLEY, IL ZIP Code
| City | HUNTLEY |
| State | Illinois |
| ZIP Codes count | 1 (see all) |
| Post offices count | 1 (see all) |
| Total population | 26,486 (see all) |
ZIP Code in HUNTLEY, Illinois
60142
This list contains only 5-digit ZIP codes. Use our zip code lookup by address feature to get the full 9-digit (ZIP+4) code.
List of HUNTLEY, IL ZIP Codes
| ZIP | TYPE | POPU |
|---|---|---|
| 60142 | STANDARD | 29,478 |
Post offices
HUNTLEY — Post Office™ 11013 N WOODSTOCK ST HUNTLEY, IL 60142-6957 |
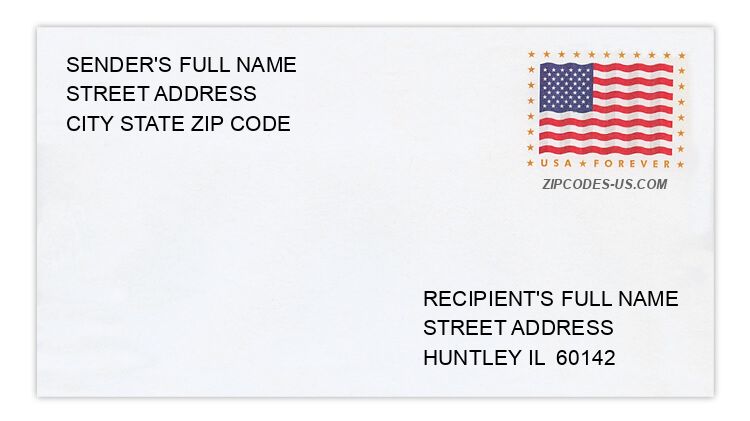
Envelope example
On the bottom center of the envelope, write the address you want your letter delivered to. Include the following on separate lines:
- Recipient's full name
- Full street address
- City, State, and ZIP Code
Using the same format, write the return address in the top left corner.
Using the full ZIP+4 Code when mailing via the USPS ensures the fastest, most accurate mailing possible. If you are not sure of the full 9-digit ZIP Code, use the 5-digit ZIP Code to avoid loss of letter or package.
The recipient address information is provided for your reference.
Address example
10434 AUBURN CT
HUNTLEY IL 60142-9000
HUNTLEY IL 60142-9000
13285 BITTERSWEET LN
HUNTLEY IL 60142-7528
HUNTLEY IL 60142-7528
13735 GUILFORD RD
HUNTLEY IL 60142-7863
HUNTLEY IL 60142-7863
14271 NEWPORT CIR
HUNTLEY IL 60142-6402
HUNTLEY IL 60142-6402
13295 OAKWOOD AVE
HUNTLEY IL 60142-6344
HUNTLEY IL 60142-6344
13078 RIVER PARK DR
HUNTLEY IL 60142-7600
HUNTLEY IL 60142-7600
Map
Hover over the map to see the ZIP code
Census data for HUNTLEY, IL
Demographic and housing estimates in HUNTLEY, IL
| Total population | 26,486 |
| Male | 12,415 |
| Female | 14,071 |
| Total population | 26,486 |
| Under 5 years | 1,242 |
| 5 to 9 years | 2,093 |
| 10 to 14 years | 1,528 |
| 15 to 19 years | 1,468 |
| 20 to 24 years | 1,128 |
| 25 to 34 years | 2,029 |
| 35 to 44 years | 3,120 |
| 45 to 54 years | 3,079 |
| 55 to 59 years | 1,298 |
| 60 to 64 years | 1,287 |
| 65 to 74 years | 4,062 |
| 75 to 84 years | 3,387 |
| 85 years and over | 765 |
| Median age (years) | 46.5 |
| Under 18 years | 5,940 |
| 16 years and over | 21,209 |
| 18 years and over | 20,546 |
| 21 years and over | 19,892 |
| 62 years and over | 8,994 |
| 65 years and over | 8,214 |
| Total population | 26,486 |
| One race | 26,052 |
| White | 23,454 |
| Black or African American | 678 |
| American Indian and Alaska Native | 0 |
| Asian | 1,598 |
| Native Hawaiian and Other Pacific Islander | 36 |
| Some other race | 286 |
| Two or more races | 434 |
| Citizen, VOTING AGE 18 and over population | 19,928 |
| Male Citizen, VOTING AGE 18 and over population | 9,131 |
| Female Citizen, VOTING AGE 18 and over population | 10,797 |
Social characteristics in HUNTLEY, IL
| Total households | 10,992 |
| Family households (families) | 7,387 |
| Married-couple family | 6,656 |
| Male householder, no wife present, family | 172 |
| Female householder, no husband present, family | 559 |
| Nonfamily households | 3,605 |
| Average household size | 2.41 |
| Average family size | 3.02 |
Economic characteristics in HUNTLEY, IL
| Total households | 10,992 |
| Less than $10,000 | 593 |
| $10,000 to $14,999 | 302 |
| $15,000 to $24,999 | 693 |
| $25,000 to $34,999 | 655 |
| $35,000 to $49,999 | 1,122 |
| $50,000 to $74,999 | 2,055 |
| $75,000 to $99,999 | 1,566 |
| $100,000 to $149,999 | 1,920 |
| $150,000 to $199,999 | 1,406 |
| $200,000 or more | 680 |
| Median household income (dollars) | 75,597 |
Housing characteristics in HUNTLEY, IL
| Total housing units | 11,712 |
| Occupied housing units | 10,992 |
| Vacant housing units | 720 |
| Total housing units | 11,712 |
| 1-unit, detached | 9,081 |
| 1-unit, attached | 1,714 |
| 2 units | 48 |
| 3 or 4 units | 317 |
| 5 to 9 units | 234 |
| 10 to 19 units | 26 |
| 20 or more units | 292 |
| Mobile home | 0 |
| Boat, RV, van, etc. | 0 |
| Total housing units | 11,712 |
| Built 2014 or later | 297 |
| Built 2010 to 2013 | 436 |
| Built 2000 to 2009 | 8,316 |
| Built 1990 to 1999 | 1,491 |
| Built 1980 to 1989 | 444 |
| Built 1970 to 1979 | 143 |
| Built 1960 to 1969 | 177 |
| Built 1950 to 1959 | 67 |
| Built 1940 to 1949 | 29 |
| Built 1939 or earlier | 312 |
| Total housing units | 11,712 |
| 1 room | 59 |
| 2 rooms | 60 |
| 3 rooms | 247 |
| 4 rooms | 1,255 |
| 5 rooms | 2,398 |
| 6 rooms | 2,540 |
| 7 rooms | 1,168 |
| 8 rooms | 1,385 |
| 9 rooms or more | 2,600 |
| Median rooms | 6.2 |
| Total housing units | 11,712 |
| No bedroom | 59 |
| 1 bedroom | 428 |
| 2 bedrooms | 5,123 |
| 3 bedrooms | 2,607 |
| 4 bedrooms | 2,942 |
| 5 or more bedrooms | 553 |
| Occupied housing units | 10,992 |
| Owner-occupied | 10,119 |
| Renter-occupied | 873 |
| Average household size of owner-occupied unit | 2.42 |
| Average household size of renter-occupied unit | 2.24 |
| Occupied housing units | 10,992 |
| Moved in 2017 or later | 411 |
| Moved in 2015 to 2016 | 1,381 |
| Moved in 2010 to 2014 | 2,822 |
| Moved in 2000 to 2009 | 5,572 |
| Moved in 1990 to 1999 | 675 |
| Moved in 1989 and earlier | 131 |
| Owner-occupied units | 10,119 |
| Less than $50,000 | 166 |
| $50,000 to $99,999 | 28 |
| $100,000 to $149,999 | 755 |
| $150,000 to $199,999 | 1,953 |
| $200,000 to $299,999 | 4,315 |
| $300,000 to $499,999 | 2,839 |
| $500,000 to $999,999 | 37 |
| $1,000,000 or more | 26 |
| Median (dollars) | 242,400 |
| Owner-occupied units | 10,119 |
| Housing units with a mortgage | 6,257 |
| Housing units without a mortgage | 3,862 |
| Occupied units paying rent | 765 |
| Less than $500 | 39 |
| $500 to $999 | 113 |
| $1,000 to $1,499 | 316 |
| $1,500 to $1,999 | 144 |
| $2,000 to $2,499 | 73 |
| $2,500 to $2,999 | 80 |
| $3,000 or more | 0 |
| Median (dollars) | 1,282 |
| No rent paid | 108 |
Data is based on 2018 Census
ZIP Codes for other locations
State for HUNTLEY
Illinois ZIP CodesOther cities in Illinois