LEBANON, IL ZIP Code
| City | LEBANON |
| State | Illinois |
| ZIP Codes count | 1 (see all) |
| Post offices count | 1 (see all) |
| Total population | 4,256 (see all) |
ZIP Code in LEBANON, Illinois
62254
This list contains only 5-digit ZIP codes. Use our zip code lookup by address feature to get the full 9-digit (ZIP+4) code.
List of LEBANON, IL ZIP Codes
| ZIP | TYPE | POPU |
|---|---|---|
| 62254 | STANDARD | 6,532 |
Post offices
LEBANON — Post Office™ 201 E SAINT LOUIS ST LEBANON, IL 62254-9998 |
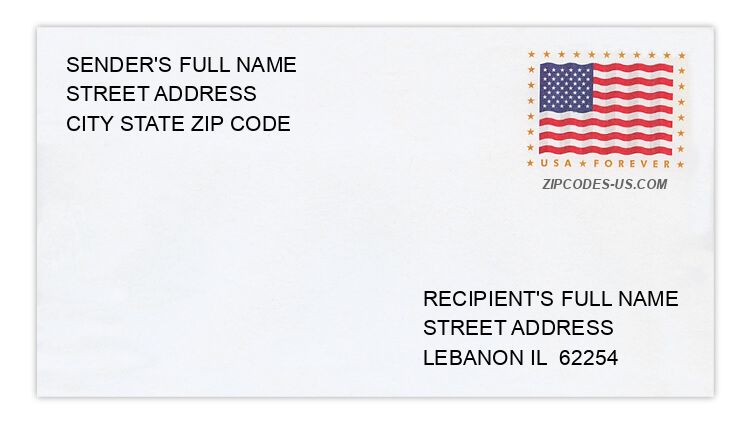
Envelope example
On the bottom center of the envelope, write the address you want your letter delivered to. Include the following on separate lines:
- Recipient's full name
- Full street address
- City, State, and ZIP Code
Using the same format, write the return address in the top left corner.
Using the full ZIP+4 Code when mailing via the USPS ensures the fastest, most accurate mailing possible. If you are not sure of the full 9-digit ZIP Code, use the 5-digit ZIP Code to avoid loss of letter or package.
The recipient address information is provided for your reference.
Address example
11281 BRANDING STONE DR
LEBANON IL 62254-1975
LEBANON IL 62254-1975
9917 DEBENTROY ST
LEBANON IL 62254-2730
LEBANON IL 62254-2730
196 N CHERRY ST
LEBANON IL 62254-1679
LEBANON IL 62254-1679
11205 OAK FOREST LN
LEBANON IL 62254-1974
LEBANON IL 62254-1974
119 PAUL PL
LEBANON IL 62254-1951
LEBANON IL 62254-1951
125 WINDY HL
LEBANON IL 62254-1959
LEBANON IL 62254-1959
Map
Hover over the map to see the ZIP code
Census data for LEBANON, IL
Demographic and housing estimates in LEBANON, IL
| Total population | 4,256 |
| Male | 1,949 |
| Female | 2,307 |
| Total population | 4,256 |
| Under 5 years | 217 |
| 5 to 9 years | 394 |
| 10 to 14 years | 107 |
| 15 to 19 years | 283 |
| 20 to 24 years | 314 |
| 25 to 34 years | 905 |
| 35 to 44 years | 453 |
| 45 to 54 years | 280 |
| 55 to 59 years | 194 |
| 60 to 64 years | 337 |
| 65 to 74 years | 449 |
| 75 to 84 years | 212 |
| 85 years and over | 111 |
| Median age (years) | 33.5 |
| Under 18 years | 835 |
| 16 years and over | 3,521 |
| 18 years and over | 3,421 |
| 21 years and over | 3,193 |
| 62 years and over | 1,046 |
| 65 years and over | 772 |
| Total population | 4,256 |
| One race | 4,105 |
| White | 3,060 |
| Black or African American | 1,045 |
| American Indian and Alaska Native | 0 |
| Asian | 0 |
| Native Hawaiian and Other Pacific Islander | 0 |
| Some other race | 0 |
| Two or more races | 151 |
| Citizen, VOTING AGE 18 and over population | 3,419 |
| Male Citizen, VOTING AGE 18 and over population | 1,561 |
| Female Citizen, VOTING AGE 18 and over population | 1,858 |
Social characteristics in LEBANON, IL
| Total households | 1,656 |
| Family households (families) | 950 |
| Married-couple family | 678 |
| Male householder, no wife present, family | 49 |
| Female householder, no husband present, family | 223 |
| Nonfamily households | 706 |
| Average household size | 2.37 |
| Average family size | 3.01 |
Economic characteristics in LEBANON, IL
| Total households | 1,656 |
| Less than $10,000 | 197 |
| $10,000 to $14,999 | 134 |
| $15,000 to $24,999 | 168 |
| $25,000 to $34,999 | 66 |
| $35,000 to $49,999 | 169 |
| $50,000 to $74,999 | 284 |
| $75,000 to $99,999 | 374 |
| $100,000 to $149,999 | 214 |
| $150,000 to $199,999 | 32 |
| $200,000 or more | 18 |
| Median household income (dollars) | 56,250 |
Housing characteristics in LEBANON, IL
| Total housing units | 1,943 |
| Occupied housing units | 1,656 |
| Vacant housing units | 287 |
| Total housing units | 1,943 |
| 1-unit, detached | 1,186 |
| 1-unit, attached | 117 |
| 2 units | 81 |
| 3 or 4 units | 149 |
| 5 to 9 units | 199 |
| 10 to 19 units | 47 |
| 20 or more units | 132 |
| Mobile home | 32 |
| Boat, RV, van, etc. | 0 |
| Total housing units | 1,943 |
| Built 2014 or later | 0 |
| Built 2010 to 2013 | 82 |
| Built 2000 to 2009 | 633 |
| Built 1990 to 1999 | 81 |
| Built 1980 to 1989 | 231 |
| Built 1970 to 1979 | 206 |
| Built 1960 to 1969 | 115 |
| Built 1950 to 1959 | 208 |
| Built 1940 to 1949 | 32 |
| Built 1939 or earlier | 355 |
| Total housing units | 1,943 |
| 1 room | 0 |
| 2 rooms | 87 |
| 3 rooms | 162 |
| 4 rooms | 318 |
| 5 rooms | 342 |
| 6 rooms | 628 |
| 7 rooms | 128 |
| 8 rooms | 98 |
| 9 rooms or more | 180 |
| Median rooms | 5.6 |
| Total housing units | 1,943 |
| No bedroom | 12 |
| 1 bedroom | 273 |
| 2 bedrooms | 621 |
| 3 bedrooms | 868 |
| 4 bedrooms | 133 |
| 5 or more bedrooms | 36 |
| Occupied housing units | 1,656 |
| Owner-occupied | 976 |
| Renter-occupied | 680 |
| Average household size of owner-occupied unit | 2.46 |
| Average household size of renter-occupied unit | 2.24 |
| Occupied housing units | 1,656 |
| Moved in 2017 or later | 16 |
| Moved in 2015 to 2016 | 378 |
| Moved in 2010 to 2014 | 593 |
| Moved in 2000 to 2009 | 327 |
| Moved in 1990 to 1999 | 126 |
| Moved in 1989 and earlier | 216 |
| Owner-occupied units | 976 |
| Less than $50,000 | 82 |
| $50,000 to $99,999 | 267 |
| $100,000 to $149,999 | 390 |
| $150,000 to $199,999 | 117 |
| $200,000 to $299,999 | 105 |
| $300,000 to $499,999 | 15 |
| $500,000 to $999,999 | 0 |
| $1,000,000 or more | 0 |
| Median (dollars) | 120,100 |
| Owner-occupied units | 976 |
| Housing units with a mortgage | 618 |
| Housing units without a mortgage | 358 |
| Occupied units paying rent | 680 |
| Less than $500 | 205 |
| $500 to $999 | 394 |
| $1,000 to $1,499 | 81 |
| $1,500 to $1,999 | 0 |
| $2,000 to $2,499 | 0 |
| $2,500 to $2,999 | 0 |
| $3,000 or more | 0 |
| Median (dollars) | 822 |
| No rent paid | 0 |
Data is based on 2018 Census
ZIP Codes for other locations
State for LEBANON
Illinois ZIP CodesOther cities in Illinois