MAROA, IL ZIP Code
| City | MAROA |
| State | Illinois |
| ZIP Codes count | 1 (see all) |
| Post offices count | 1 (see all) |
| Total population | 1,674 (see all) |
ZIP Code in MAROA, Illinois
61756
This list contains only 5-digit ZIP codes. Use our zip code lookup by address feature to get the full 9-digit (ZIP+4) code.
List of MAROA, IL ZIP Codes
| ZIP | TYPE | POPU |
|---|---|---|
| 61756 | STANDARD | 2,575 |
Post offices
MAROA — Post Office™ 200 E MAIN ST MAROA, IL 61756-7502 |
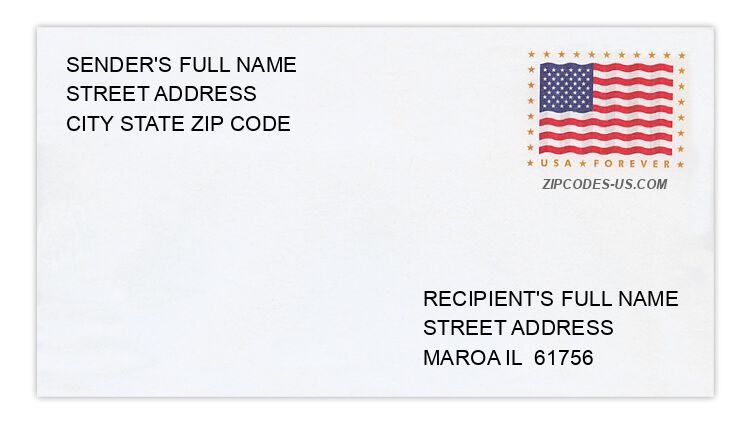
Envelope example
On the bottom center of the envelope, write the address you want your letter delivered to. Include the following on separate lines:
- Recipient's full name
- Full street address
- City, State, and ZIP Code
Using the same format, write the return address in the top left corner.
Using the full ZIP+4 Code when mailing via the USPS ensures the fastest, most accurate mailing possible. If you are not sure of the full 9-digit ZIP Code, use the 5-digit ZIP Code to avoid loss of letter or package.
The recipient address information is provided for your reference.
Address example
15474 CEMETERY RD
MAROA IL 61756-9147
MAROA IL 61756-9147
12698 GLASGOW RD
MAROA IL 61756-9094
MAROA IL 61756-9094
11927 OAKLAND AVE
MAROA IL 61756-9039
MAROA IL 61756-9039
5934 ROWELL RD
MAROA IL 61756-9657
MAROA IL 61756-9657
243 S CHESTNUT ST
MAROA IL 61756-7538
MAROA IL 61756-7538
173 S ELM ST
MAROA IL 61756-9215
MAROA IL 61756-9215
Map
Hover over the map to see the ZIP code
Census data for MAROA, IL
Demographic and housing estimates in MAROA, IL
| Total population | 1,674 |
| Male | 866 |
| Female | 808 |
| Total population | 1,674 |
| Under 5 years | 74 |
| 5 to 9 years | 134 |
| 10 to 14 years | 160 |
| 15 to 19 years | 123 |
| 20 to 24 years | 117 |
| 25 to 34 years | 168 |
| 35 to 44 years | 185 |
| 45 to 54 years | 285 |
| 55 to 59 years | 129 |
| 60 to 64 years | 63 |
| 65 to 74 years | 133 |
| 75 to 84 years | 60 |
| 85 years and over | 43 |
| Median age (years) | 38.3 |
| Under 18 years | 453 |
| 16 years and over | 1,277 |
| 18 years and over | 1,221 |
| 21 years and over | 1,169 |
| 62 years and over | 267 |
| 65 years and over | 236 |
| Total population | 1,674 |
| One race | 1,476 |
| White | 1,452 |
| Black or African American | 11 |
| American Indian and Alaska Native | 0 |
| Asian | 13 |
| Native Hawaiian and Other Pacific Islander | 0 |
| Some other race | 0 |
| Two or more races | 198 |
| Citizen, VOTING AGE 18 and over population | 1,221 |
| Male Citizen, VOTING AGE 18 and over population | 610 |
| Female Citizen, VOTING AGE 18 and over population | 611 |
Social characteristics in MAROA, IL
| Total households | 652 |
| Family households (families) | 470 |
| Married-couple family | 327 |
| Male householder, no wife present, family | 27 |
| Female householder, no husband present, family | 116 |
| Nonfamily households | 182 |
| Average household size | 2.57 |
| Average family size | 3.05 |
Economic characteristics in MAROA, IL
| Total households | 652 |
| Less than $10,000 | 10 |
| $10,000 to $14,999 | 26 |
| $15,000 to $24,999 | 71 |
| $25,000 to $34,999 | 81 |
| $35,000 to $49,999 | 92 |
| $50,000 to $74,999 | 118 |
| $75,000 to $99,999 | 87 |
| $100,000 to $149,999 | 122 |
| $150,000 to $199,999 | 28 |
| $200,000 or more | 17 |
| Median household income (dollars) | 61,923 |
Housing characteristics in MAROA, IL
| Total housing units | 737 |
| Occupied housing units | 652 |
| Vacant housing units | 85 |
| Total housing units | 737 |
| 1-unit, detached | 591 |
| 1-unit, attached | 0 |
| 2 units | 6 |
| 3 or 4 units | 0 |
| 5 to 9 units | 29 |
| 10 to 19 units | 12 |
| 20 or more units | 14 |
| Mobile home | 85 |
| Boat, RV, van, etc. | 0 |
| Total housing units | 737 |
| Built 2014 or later | 11 |
| Built 2010 to 2013 | 0 |
| Built 2000 to 2009 | 65 |
| Built 1990 to 1999 | 55 |
| Built 1980 to 1989 | 60 |
| Built 1970 to 1979 | 116 |
| Built 1960 to 1969 | 68 |
| Built 1950 to 1959 | 83 |
| Built 1940 to 1949 | 49 |
| Built 1939 or earlier | 230 |
| Total housing units | 737 |
| 1 room | 9 |
| 2 rooms | 12 |
| 3 rooms | 28 |
| 4 rooms | 101 |
| 5 rooms | 116 |
| 6 rooms | 197 |
| 7 rooms | 120 |
| 8 rooms | 69 |
| 9 rooms or more | 85 |
| Median rooms | 6.0 |
| Total housing units | 737 |
| No bedroom | 9 |
| 1 bedroom | 62 |
| 2 bedrooms | 139 |
| 3 bedrooms | 396 |
| 4 bedrooms | 113 |
| 5 or more bedrooms | 18 |
| Occupied housing units | 652 |
| Owner-occupied | 524 |
| Renter-occupied | 128 |
| Average household size of owner-occupied unit | 2.63 |
| Average household size of renter-occupied unit | 2.31 |
| Occupied housing units | 652 |
| Moved in 2017 or later | 40 |
| Moved in 2015 to 2016 | 52 |
| Moved in 2010 to 2014 | 109 |
| Moved in 2000 to 2009 | 215 |
| Moved in 1990 to 1999 | 91 |
| Moved in 1989 and earlier | 145 |
| Owner-occupied units | 524 |
| Less than $50,000 | 86 |
| $50,000 to $99,999 | 201 |
| $100,000 to $149,999 | 122 |
| $150,000 to $199,999 | 52 |
| $200,000 to $299,999 | 46 |
| $300,000 to $499,999 | 4 |
| $500,000 to $999,999 | 11 |
| $1,000,000 or more | 2 |
| Median (dollars) | 91,900 |
| Owner-occupied units | 524 |
| Housing units with a mortgage | 316 |
| Housing units without a mortgage | 208 |
| Occupied units paying rent | 119 |
| Less than $500 | 31 |
| $500 to $999 | 62 |
| $1,000 to $1,499 | 23 |
| $1,500 to $1,999 | 3 |
| $2,000 to $2,499 | 0 |
| $2,500 to $2,999 | 0 |
| $3,000 or more | 0 |
| Median (dollars) | 592 |
| No rent paid | 9 |
Data is based on 2018 Census
ZIP Codes for other locations
State for MAROA
Illinois ZIP CodesOther cities in Illinois