MONMOUTH, IL ZIP Code
| City | MONMOUTH |
| State | Illinois |
| ZIP Codes count | 1 (see all) |
| Post offices count | 1 (see all) |
| Total population | 9,189 (see all) |
ZIP Code in MONMOUTH, Illinois
61462
This list contains only 5-digit ZIP codes. Use our zip code lookup by address feature to get the full 9-digit (ZIP+4) code.
List of MONMOUTH, IL ZIP Codes
| ZIP | TYPE | POPU |
|---|---|---|
| 61462 | STANDARD | 11,035 |
Post offices
MONMOUTH — Post Office™ 235 S 1ST ST MONMOUTH, IL 61462-9998 |
Envelope example
On the bottom center of the envelope, write the address you want your letter delivered to. Include the following on separate lines:
- Recipient's full name
- Full street address
- City, State, and ZIP Code
Using the same format, write the return address in the top left corner.
Using the full ZIP+4 Code when mailing via the USPS ensures the fastest, most accurate mailing possible. If you are not sure of the full 9-digit ZIP Code, use the 5-digit ZIP Code to avoid loss of letter or package.
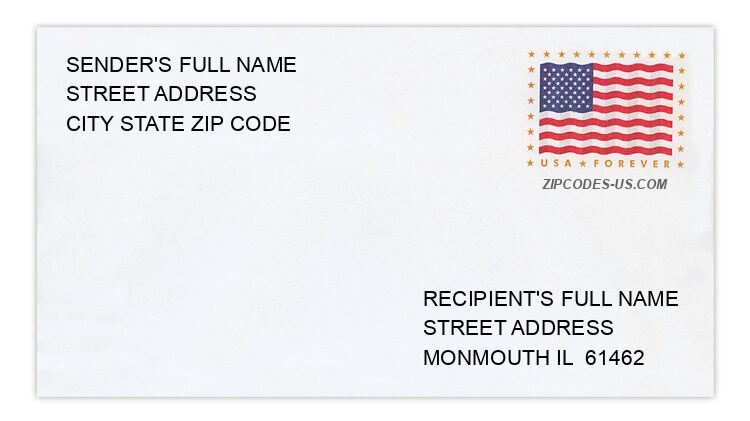
The recipient address information is provided for your reference.
Address example
1420 90TH ST
MONMOUTH IL 61462-8811
MONMOUTH IL 61462-8811
495 N A ST
MONMOUTH IL 61462-1725
MONMOUTH IL 61462-1725
538 N D ST
MONMOUTH IL 61462-1126
MONMOUTH IL 61462-1126
1213 N PARK CIR
MONMOUTH IL 61462-9695
MONMOUTH IL 61462-9695
221 S I ST
MONMOUTH IL 61462-2067
MONMOUTH IL 61462-2067
567 W 13TH AVE
MONMOUTH IL 61462-25ND
MONMOUTH IL 61462-25ND
Map
Hover over the map to see the ZIP code
Census data for MONMOUTH, IL
Demographic and housing estimates in MONMOUTH, IL
| Total population | 9,189 |
| Male | 4,251 |
| Female | 4,938 |
| Total population | 9,189 |
| Under 5 years | 624 |
| 5 to 9 years | 588 |
| 10 to 14 years | 537 |
| 15 to 19 years | 1,047 |
| 20 to 24 years | 941 |
| 25 to 34 years | 978 |
| 35 to 44 years | 1,098 |
| 45 to 54 years | 863 |
| 55 to 59 years | 636 |
| 60 to 64 years | 389 |
| 65 to 74 years | 775 |
| 75 to 84 years | 535 |
| 85 years and over | 178 |
| Median age (years) | 34.1 |
| Under 18 years | 2,128 |
| 16 years and over | 7,285 |
| 18 years and over | 7,061 |
| 21 years and over | 6,069 |
| 62 years and over | 1,693 |
| 65 years and over | 1,488 |
| Total population | 9,189 |
| One race | 8,940 |
| White | 7,401 |
| Black or African American | 411 |
| American Indian and Alaska Native | 29 |
| Asian | 395 |
| Native Hawaiian and Other Pacific Islander | 0 |
| Some other race | 704 |
| Two or more races | 249 |
| Citizen, VOTING AGE 18 and over population | 6,468 |
| Male Citizen, VOTING AGE 18 and over population | 3,034 |
| Female Citizen, VOTING AGE 18 and over population | 3,434 |
Social characteristics in MONMOUTH, IL
| Total households | 3,494 |
| Family households (families) | 2,206 |
| Married-couple family | 1,439 |
| Male householder, no wife present, family | 178 |
| Female householder, no husband present, family | 589 |
| Nonfamily households | 1,288 |
| Average household size | 2.32 |
| Average family size | 2.94 |
Economic characteristics in MONMOUTH, IL
| Total households | 3,494 |
| Less than $10,000 | 342 |
| $10,000 to $14,999 | 156 |
| $15,000 to $24,999 | 460 |
| $25,000 to $34,999 | 334 |
| $35,000 to $49,999 | 801 |
| $50,000 to $74,999 | 652 |
| $75,000 to $99,999 | 320 |
| $100,000 to $149,999 | 314 |
| $150,000 to $199,999 | 26 |
| $200,000 or more | 89 |
| Median household income (dollars) | 40,781 |
Housing characteristics in MONMOUTH, IL
| Total housing units | 3,913 |
| Occupied housing units | 3,494 |
| Vacant housing units | 419 |
| Total housing units | 3,913 |
| 1-unit, detached | 2,841 |
| 1-unit, attached | 133 |
| 2 units | 139 |
| 3 or 4 units | 264 |
| 5 to 9 units | 138 |
| 10 to 19 units | 12 |
| 20 or more units | 218 |
| Mobile home | 168 |
| Boat, RV, van, etc. | 0 |
| Total housing units | 3,913 |
| Built 2014 or later | 0 |
| Built 2010 to 2013 | 0 |
| Built 2000 to 2009 | 215 |
| Built 1990 to 1999 | 125 |
| Built 1980 to 1989 | 133 |
| Built 1970 to 1979 | 527 |
| Built 1960 to 1969 | 219 |
| Built 1950 to 1959 | 570 |
| Built 1940 to 1949 | 470 |
| Built 1939 or earlier | 1,654 |
| Total housing units | 3,913 |
| 1 room | 275 |
| 2 rooms | 56 |
| 3 rooms | 241 |
| 4 rooms | 723 |
| 5 rooms | 733 |
| 6 rooms | 842 |
| 7 rooms | 524 |
| 8 rooms | 237 |
| 9 rooms or more | 282 |
| Median rooms | 5.4 |
| Total housing units | 3,913 |
| No bedroom | 289 |
| 1 bedroom | 417 |
| 2 bedrooms | 1,315 |
| 3 bedrooms | 1,379 |
| 4 bedrooms | 445 |
| 5 or more bedrooms | 68 |
| Occupied housing units | 3,494 |
| Owner-occupied | 2,346 |
| Renter-occupied | 1,148 |
| Average household size of owner-occupied unit | 2.44 |
| Average household size of renter-occupied unit | 2.06 |
| Occupied housing units | 3,494 |
| Moved in 2017 or later | 127 |
| Moved in 2015 to 2016 | 371 |
| Moved in 2010 to 2014 | 1,127 |
| Moved in 2000 to 2009 | 877 |
| Moved in 1990 to 1999 | 535 |
| Moved in 1989 and earlier | 457 |
| Owner-occupied units | 2,346 |
| Less than $50,000 | 593 |
| $50,000 to $99,999 | 1,083 |
| $100,000 to $149,999 | 387 |
| $150,000 to $199,999 | 188 |
| $200,000 to $299,999 | 72 |
| $300,000 to $499,999 | 14 |
| $500,000 to $999,999 | 0 |
| $1,000,000 or more | 9 |
| Median (dollars) | 73,500 |
| Owner-occupied units | 2,346 |
| Housing units with a mortgage | 1,217 |
| Housing units without a mortgage | 1,129 |
| Occupied units paying rent | 1,093 |
| Less than $500 | 319 |
| $500 to $999 | 670 |
| $1,000 to $1,499 | 93 |
| $1,500 to $1,999 | 0 |
| $2,000 to $2,499 | 0 |
| $2,500 to $2,999 | 0 |
| $3,000 or more | 11 |
| Median (dollars) | 642 |
| No rent paid | 55 |
Data is based on 2018 Census
ZIP Codes for other locations
State for MONMOUTH
Illinois ZIP CodesOther cities in Illinois