MOUNT STERLING, IL ZIP Code
| City | MOUNT STERLING |
| State | Illinois |
| ZIP Codes count | 1 (see all) |
| Post offices count | 1 (see all) |
| Total population | 2,227 (see all) |
ZIP Code in MOUNT STERLING, Illinois
62353
This list contains only 5-digit ZIP codes. Use our zip code lookup by address feature to get the full 9-digit (ZIP+4) code.
List of MOUNT STERLING, IL ZIP Codes
| ZIP | TYPE | POPU |
|---|---|---|
| 62353 | STANDARD | 4,993 |
Post offices
MOUNT STERLING — Post Office™ 130 W MAIN ST MOUNT STERLING, IL 62353-9998 |
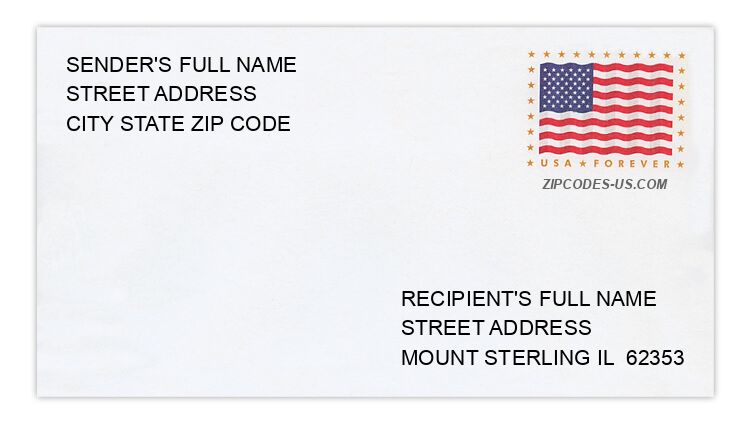
Envelope example
On the bottom center of the envelope, write the address you want your letter delivered to. Include the following on separate lines:
- Recipient's full name
- Full street address
- City, State, and ZIP Code
Using the same format, write the return address in the top left corner.
Using the full ZIP+4 Code when mailing via the USPS ensures the fastest, most accurate mailing possible. If you are not sure of the full 9-digit ZIP Code, use the 5-digit ZIP Code to avoid loss of letter or package.
The recipient address information is provided for your reference.
Address example
866 1075E ST
MOUNT STERLING IL 62353-4712
MOUNT STERLING IL 62353-4712
906 440N AVE
MOUNT STERLING IL 62353-1685
MOUNT STERLING IL 62353-1685
939 725E ST
MOUNT STERLING IL 62353-1731
MOUNT STERLING IL 62353-1731
263 800E ST
MOUNT STERLING IL 62353-1747
MOUNT STERLING IL 62353-1747
187 E COLINE ST
MOUNT STERLING IL 62353-1517
MOUNT STERLING IL 62353-1517
55 INGLESIDE DR
MOUNT STERLING IL 62353-1307
MOUNT STERLING IL 62353-1307
Map
Hover over the map to see the ZIP code
Census data for MOUNT STERLING, IL
Demographic and housing estimates in MOUNT STERLING, IL
| Total population | 2,227 |
| Male | 1,168 |
| Female | 1,059 |
| Total population | 2,227 |
| Under 5 years | 165 |
| 5 to 9 years | 165 |
| 10 to 14 years | 164 |
| 15 to 19 years | 94 |
| 20 to 24 years | 173 |
| 25 to 34 years | 377 |
| 35 to 44 years | 273 |
| 45 to 54 years | 244 |
| 55 to 59 years | 102 |
| 60 to 64 years | 109 |
| 65 to 74 years | 151 |
| 75 to 84 years | 107 |
| 85 years and over | 103 |
| Median age (years) | 34.5 |
| Under 18 years | 540 |
| 16 years and over | 1,715 |
| 18 years and over | 1,687 |
| 21 years and over | 1,621 |
| 62 years and over | 437 |
| 65 years and over | 361 |
| Total population | 2,227 |
| One race | 2,201 |
| White | 2,127 |
| Black or African American | 37 |
| American Indian and Alaska Native | 0 |
| Asian | 37 |
| Native Hawaiian and Other Pacific Islander | 0 |
| Some other race | 0 |
| Two or more races | 26 |
| Citizen, VOTING AGE 18 and over population | 1,679 |
| Male Citizen, VOTING AGE 18 and over population | 878 |
| Female Citizen, VOTING AGE 18 and over population | 801 |
Social characteristics in MOUNT STERLING, IL
| Total households | 946 |
| Family households (families) | 535 |
| Married-couple family | 400 |
| Male householder, no wife present, family | 8 |
| Female householder, no husband present, family | 127 |
| Nonfamily households | 411 |
| Average household size | 2.27 |
| Average family size | 3.02 |
Economic characteristics in MOUNT STERLING, IL
| Total households | 946 |
| Less than $10,000 | 52 |
| $10,000 to $14,999 | 89 |
| $15,000 to $24,999 | 117 |
| $25,000 to $34,999 | 88 |
| $35,000 to $49,999 | 115 |
| $50,000 to $74,999 | 185 |
| $75,000 to $99,999 | 99 |
| $100,000 to $149,999 | 171 |
| $150,000 to $199,999 | 17 |
| $200,000 or more | 13 |
| Median household income (dollars) | 51,304 |
Housing characteristics in MOUNT STERLING, IL
| Total housing units | 1,066 |
| Occupied housing units | 946 |
| Vacant housing units | 120 |
| Total housing units | 1,066 |
| 1-unit, detached | 782 |
| 1-unit, attached | 9 |
| 2 units | 54 |
| 3 or 4 units | 58 |
| 5 to 9 units | 32 |
| 10 to 19 units | 73 |
| 20 or more units | 0 |
| Mobile home | 58 |
| Boat, RV, van, etc. | 0 |
| Total housing units | 1,066 |
| Built 2014 or later | 4 |
| Built 2010 to 2013 | 0 |
| Built 2000 to 2009 | 76 |
| Built 1990 to 1999 | 132 |
| Built 1980 to 1989 | 58 |
| Built 1970 to 1979 | 147 |
| Built 1960 to 1969 | 136 |
| Built 1950 to 1959 | 129 |
| Built 1940 to 1949 | 83 |
| Built 1939 or earlier | 301 |
| Total housing units | 1,066 |
| 1 room | 11 |
| 2 rooms | 10 |
| 3 rooms | 114 |
| 4 rooms | 159 |
| 5 rooms | 268 |
| 6 rooms | 111 |
| 7 rooms | 146 |
| 8 rooms | 163 |
| 9 rooms or more | 84 |
| Median rooms | 5.4 |
| Total housing units | 1,066 |
| No bedroom | 11 |
| 1 bedroom | 154 |
| 2 bedrooms | 315 |
| 3 bedrooms | 437 |
| 4 bedrooms | 110 |
| 5 or more bedrooms | 39 |
| Occupied housing units | 946 |
| Owner-occupied | 605 |
| Renter-occupied | 341 |
| Average household size of owner-occupied unit | 2.43 |
| Average household size of renter-occupied unit | 2.00 |
| Occupied housing units | 946 |
| Moved in 2017 or later | 18 |
| Moved in 2015 to 2016 | 122 |
| Moved in 2010 to 2014 | 287 |
| Moved in 2000 to 2009 | 257 |
| Moved in 1990 to 1999 | 124 |
| Moved in 1989 and earlier | 138 |
| Owner-occupied units | 605 |
| Less than $50,000 | 96 |
| $50,000 to $99,999 | 289 |
| $100,000 to $149,999 | 135 |
| $150,000 to $199,999 | 55 |
| $200,000 to $299,999 | 22 |
| $300,000 to $499,999 | 4 |
| $500,000 to $999,999 | 4 |
| $1,000,000 or more | 0 |
| Median (dollars) | 89,000 |
| Owner-occupied units | 605 |
| Housing units with a mortgage | 353 |
| Housing units without a mortgage | 252 |
| Occupied units paying rent | 317 |
| Less than $500 | 152 |
| $500 to $999 | 160 |
| $1,000 to $1,499 | 5 |
| $1,500 to $1,999 | 0 |
| $2,000 to $2,499 | 0 |
| $2,500 to $2,999 | 0 |
| $3,000 or more | 0 |
| Median (dollars) | 546 |
| No rent paid | 24 |
Data is based on 2018 Census
ZIP Codes for other locations
State for MOUNT STERLING
Illinois ZIP CodesOther cities in Illinois