OLNEY, IL ZIP Code
| City | OLNEY |
| State | Illinois |
| ZIP Codes count | 1 (see all) |
| Post offices count | 1 (see all) |
| Total population | 8,808 (see all) |
ZIP Code in OLNEY, Illinois
62450
This list contains only 5-digit ZIP codes. Use our zip code lookup by address feature to get the full 9-digit (ZIP+4) code.
List of OLNEY, IL ZIP Codes
| ZIP | TYPE | POPU |
|---|---|---|
| 62450 | STANDARD | 12,551 |
Post offices
OLNEY — Post Office™ 330 S WHITTLE AVE OLNEY, IL 62450-9998 |
Envelope example
On the bottom center of the envelope, write the address you want your letter delivered to. Include the following on separate lines:
- Recipient's full name
- Full street address
- City, State, and ZIP Code
Using the same format, write the return address in the top left corner.
Using the full ZIP+4 Code when mailing via the USPS ensures the fastest, most accurate mailing possible. If you are not sure of the full 9-digit ZIP Code, use the 5-digit ZIP Code to avoid loss of letter or package.
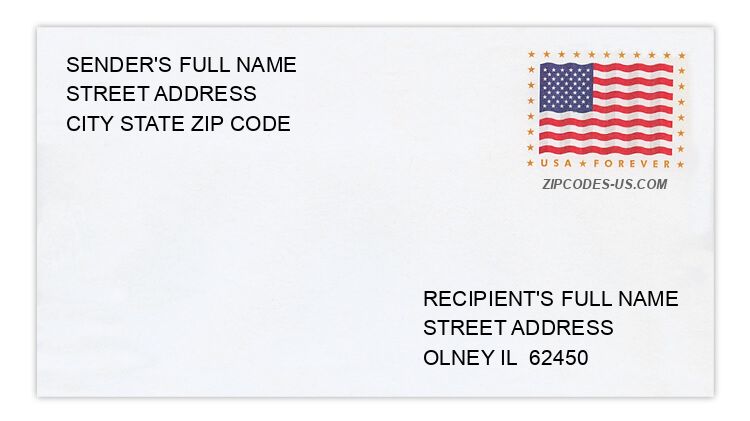
The recipient address information is provided for your reference.
Address example
234 E HARMON ST
OLNEY IL 62450-1828
OLNEY IL 62450-1828
370 LUCAS ST
OLNEY IL 62450-1437
OLNEY IL 62450-1437
3415 N UNION DR
OLNEY IL 62450-5142
OLNEY IL 62450-5142
508 SHIELDS ST
OLNEY IL 62450-1210
OLNEY IL 62450-1210
712 SHIPLEY ST
OLNEY IL 62450-3031
OLNEY IL 62450-3031
906 W GROVE ST
OLNEY IL 62450-1316
OLNEY IL 62450-1316
Map
Hover over the map to see the ZIP code
Census data for OLNEY, IL
Demographic and housing estimates in OLNEY, IL
| Total population | 8,808 |
| Male | 4,190 |
| Female | 4,618 |
| Total population | 8,808 |
| Under 5 years | 629 |
| 5 to 9 years | 491 |
| 10 to 14 years | 597 |
| 15 to 19 years | 520 |
| 20 to 24 years | 577 |
| 25 to 34 years | 852 |
| 35 to 44 years | 1,118 |
| 45 to 54 years | 969 |
| 55 to 59 years | 758 |
| 60 to 64 years | 481 |
| 65 to 74 years | 707 |
| 75 to 84 years | 688 |
| 85 years and over | 421 |
| Median age (years) | 40.6 |
| Under 18 years | 2,080 |
| 16 years and over | 6,996 |
| 18 years and over | 6,728 |
| 21 years and over | 6,477 |
| 62 years and over | 2,116 |
| 65 years and over | 1,816 |
| Total population | 8,808 |
| One race | 8,767 |
| White | 8,383 |
| Black or African American | 130 |
| American Indian and Alaska Native | 42 |
| Asian | 128 |
| Native Hawaiian and Other Pacific Islander | 0 |
| Some other race | 84 |
| Two or more races | 41 |
| Citizen, VOTING AGE 18 and over population | 6,579 |
| Male Citizen, VOTING AGE 18 and over population | 3,098 |
| Female Citizen, VOTING AGE 18 and over population | 3,481 |
Social characteristics in OLNEY, IL
| Total households | 3,762 |
| Family households (families) | 2,122 |
| Married-couple family | 1,529 |
| Male householder, no wife present, family | 103 |
| Female householder, no husband present, family | 490 |
| Nonfamily households | 1,640 |
| Average household size | 2.26 |
| Average family size | 3.01 |
Economic characteristics in OLNEY, IL
| Total households | 3,762 |
| Less than $10,000 | 394 |
| $10,000 to $14,999 | 360 |
| $15,000 to $24,999 | 461 |
| $25,000 to $34,999 | 457 |
| $35,000 to $49,999 | 525 |
| $50,000 to $74,999 | 599 |
| $75,000 to $99,999 | 436 |
| $100,000 to $149,999 | 343 |
| $150,000 to $199,999 | 74 |
| $200,000 or more | 113 |
| Median household income (dollars) | 39,558 |
Housing characteristics in OLNEY, IL
| Total housing units | 4,465 |
| Occupied housing units | 3,762 |
| Vacant housing units | 703 |
| Total housing units | 4,465 |
| 1-unit, detached | 3,480 |
| 1-unit, attached | 35 |
| 2 units | 157 |
| 3 or 4 units | 162 |
| 5 to 9 units | 102 |
| 10 to 19 units | 69 |
| 20 or more units | 222 |
| Mobile home | 238 |
| Boat, RV, van, etc. | 0 |
| Total housing units | 4,465 |
| Built 2014 or later | 15 |
| Built 2010 to 2013 | 30 |
| Built 2000 to 2009 | 227 |
| Built 1990 to 1999 | 433 |
| Built 1980 to 1989 | 535 |
| Built 1970 to 1979 | 786 |
| Built 1960 to 1969 | 432 |
| Built 1950 to 1959 | 769 |
| Built 1940 to 1949 | 436 |
| Built 1939 or earlier | 802 |
| Total housing units | 4,465 |
| 1 room | 155 |
| 2 rooms | 137 |
| 3 rooms | 276 |
| 4 rooms | 816 |
| 5 rooms | 963 |
| 6 rooms | 771 |
| 7 rooms | 647 |
| 8 rooms | 257 |
| 9 rooms or more | 443 |
| Median rooms | 5.4 |
| Total housing units | 4,465 |
| No bedroom | 164 |
| 1 bedroom | 545 |
| 2 bedrooms | 1,282 |
| 3 bedrooms | 1,835 |
| 4 bedrooms | 470 |
| 5 or more bedrooms | 169 |
| Occupied housing units | 3,762 |
| Owner-occupied | 2,314 |
| Renter-occupied | 1,448 |
| Average household size of owner-occupied unit | 2.46 |
| Average household size of renter-occupied unit | 1.93 |
| Occupied housing units | 3,762 |
| Moved in 2017 or later | 145 |
| Moved in 2015 to 2016 | 527 |
| Moved in 2010 to 2014 | 1,152 |
| Moved in 2000 to 2009 | 873 |
| Moved in 1990 to 1999 | 458 |
| Moved in 1989 and earlier | 607 |
| Owner-occupied units | 2,314 |
| Less than $50,000 | 619 |
| $50,000 to $99,999 | 769 |
| $100,000 to $149,999 | 434 |
| $150,000 to $199,999 | 249 |
| $200,000 to $299,999 | 153 |
| $300,000 to $499,999 | 62 |
| $500,000 to $999,999 | 28 |
| $1,000,000 or more | 0 |
| Median (dollars) | 83,600 |
| Owner-occupied units | 2,314 |
| Housing units with a mortgage | 1,082 |
| Housing units without a mortgage | 1,232 |
| Occupied units paying rent | 1,320 |
| Less than $500 | 518 |
| $500 to $999 | 739 |
| $1,000 to $1,499 | 39 |
| $1,500 to $1,999 | 0 |
| $2,000 to $2,499 | 0 |
| $2,500 to $2,999 | 24 |
| $3,000 or more | 0 |
| Median (dollars) | 538 |
| No rent paid | 128 |
Data is based on 2018 Census
ZIP Codes for other locations
State for OLNEY
Illinois ZIP CodesOther cities in Illinois