PINGREE GROVE, IL ZIP Code
| City | PINGREE GROVE |
| State | Illinois |
| ZIP Codes count | 1 (see all) |
| Post offices count | 1 (see all) |
| Total population | 7,337 (see all) |
ZIP Code in PINGREE GROVE, Illinois
60140
This list contains only 5-digit ZIP codes. Use our zip code lookup by address feature to get the full 9-digit (ZIP+4) code.
List of PINGREE GROVE, IL ZIP Codes
| ZIP | TYPE | POPU |
|---|---|---|
| 60140 | STANDARD | 20,859 |
Post offices
HAMPSHIRE — Post Office™ 196 WASHINGTON AVE HAMPSHIRE, IL 60140-1000 |
Envelope example
On the bottom center of the envelope, write the address you want your letter delivered to. Include the following on separate lines:
- Recipient's full name
- Full street address
- City, State, and ZIP Code
Using the same format, write the return address in the top left corner.
Using the full ZIP+4 Code when mailing via the USPS ensures the fastest, most accurate mailing possible. If you are not sure of the full 9-digit ZIP Code, use the 5-digit ZIP Code to avoid loss of letter or package.
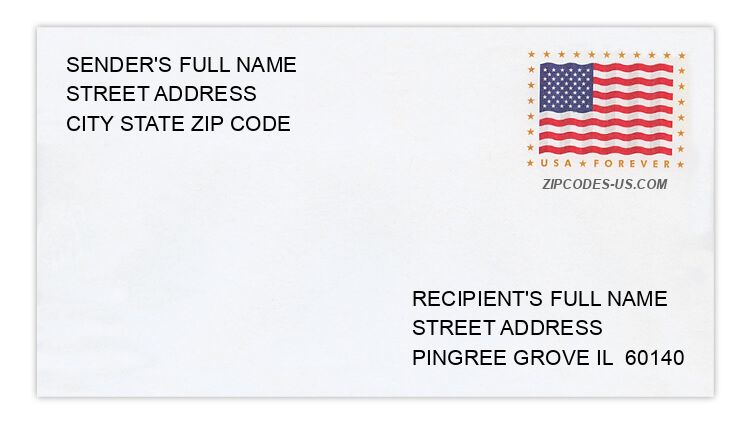
The recipient address information is provided for your reference.
Address example
1735 DEMPSEY CIR
PINGREE GROVE IL 60140-8019
PINGREE GROVE IL 60140-8019
1352 NEWPORT CT
PINGREE GROVE IL 60140-2073
PINGREE GROVE IL 60140-2073
113 NORFOLK LN
PINGREE GROVE IL 60140-8827
PINGREE GROVE IL 60140-8827
1156 WHITE PINE TRL
PINGREE GROVE IL 60140-9111
PINGREE GROVE IL 60140-9111
1500 WINDWARD DR
PINGREE GROVE IL 60140-2061
PINGREE GROVE IL 60140-2061
780 WOODFERN DR
PINGREE GROVE IL 60140-9153
PINGREE GROVE IL 60140-9153
Map
Hover over the map to see the ZIP code
Census data for PINGREE GROVE, IL
Demographic and housing estimates in PINGREE GROVE, IL
| Total population | 7,337 |
| Male | 3,477 |
| Female | 3,860 |
| Total population | 7,337 |
| Under 5 years | 468 |
| 5 to 9 years | 727 |
| 10 to 14 years | 964 |
| 15 to 19 years | 125 |
| 20 to 24 years | 314 |
| 25 to 34 years | 816 |
| 35 to 44 years | 1,238 |
| 45 to 54 years | 926 |
| 55 to 59 years | 514 |
| 60 to 64 years | 577 |
| 65 to 74 years | 611 |
| 75 to 84 years | 57 |
| 85 years and over | 0 |
| Median age (years) | 38.7 |
| Under 18 years | 2,284 |
| 16 years and over | 5,141 |
| 18 years and over | 5,053 |
| 21 years and over | 4,794 |
| 62 years and over | 906 |
| 65 years and over | 668 |
| Total population | 7,337 |
| One race | 7,129 |
| White | 6,330 |
| Black or African American | 148 |
| American Indian and Alaska Native | 0 |
| Asian | 320 |
| Native Hawaiian and Other Pacific Islander | 0 |
| Some other race | 331 |
| Two or more races | 208 |
| Citizen, VOTING AGE 18 and over population | 5,053 |
| Male Citizen, VOTING AGE 18 and over population | 2,574 |
| Female Citizen, VOTING AGE 18 and over population | 2,479 |
Social characteristics in PINGREE GROVE, IL
| Total households | 2,639 |
| Family households (families) | 2,039 |
| Married-couple family | 1,716 |
| Male householder, no wife present, family | 128 |
| Female householder, no husband present, family | 195 |
| Nonfamily households | 600 |
| Average household size | 2.78 |
| Average family size | 3.23 |
Economic characteristics in PINGREE GROVE, IL
| Total households | 2,639 |
| Less than $10,000 | 365 |
| $10,000 to $14,999 | 0 |
| $15,000 to $24,999 | 17 |
| $25,000 to $34,999 | 152 |
| $35,000 to $49,999 | 107 |
| $50,000 to $74,999 | 367 |
| $75,000 to $99,999 | 703 |
| $100,000 to $149,999 | 541 |
| $150,000 to $199,999 | 362 |
| $200,000 or more | 25 |
| Median household income (dollars) | 91,042 |
Housing characteristics in PINGREE GROVE, IL
| Total housing units | 2,824 |
| Occupied housing units | 2,639 |
| Vacant housing units | 185 |
| Total housing units | 2,824 |
| 1-unit, detached | 1,533 |
| 1-unit, attached | 1,241 |
| 2 units | 0 |
| 3 or 4 units | 0 |
| 5 to 9 units | 0 |
| 10 to 19 units | 50 |
| 20 or more units | 0 |
| Mobile home | 0 |
| Boat, RV, van, etc. | 0 |
| Total housing units | 2,824 |
| Built 2014 or later | 368 |
| Built 2010 to 2013 | 395 |
| Built 2000 to 2009 | 1,984 |
| Built 1990 to 1999 | 0 |
| Built 1980 to 1989 | 0 |
| Built 1970 to 1979 | 0 |
| Built 1960 to 1969 | 0 |
| Built 1950 to 1959 | 0 |
| Built 1940 to 1949 | 0 |
| Built 1939 or earlier | 77 |
| Total housing units | 2,824 |
| 1 room | 0 |
| 2 rooms | 0 |
| 3 rooms | 0 |
| 4 rooms | 138 |
| 5 rooms | 417 |
| 6 rooms | 592 |
| 7 rooms | 271 |
| 8 rooms | 753 |
| 9 rooms or more | 653 |
| Median rooms | 7.5 |
| Total housing units | 2,824 |
| No bedroom | 0 |
| 1 bedroom | 0 |
| 2 bedrooms | 1,099 |
| 3 bedrooms | 762 |
| 4 bedrooms | 897 |
| 5 or more bedrooms | 66 |
| Occupied housing units | 2,639 |
| Owner-occupied | 2,048 |
| Renter-occupied | 591 |
| Average household size of owner-occupied unit | 2.78 |
| Average household size of renter-occupied unit | 2.77 |
| Occupied housing units | 2,639 |
| Moved in 2017 or later | 153 |
| Moved in 2015 to 2016 | 705 |
| Moved in 2010 to 2014 | 980 |
| Moved in 2000 to 2009 | 801 |
| Moved in 1990 to 1999 | 0 |
| Moved in 1989 and earlier | 0 |
| Owner-occupied units | 2,048 |
| Less than $50,000 | 114 |
| $50,000 to $99,999 | 113 |
| $100,000 to $149,999 | 53 |
| $150,000 to $199,999 | 436 |
| $200,000 to $299,999 | 875 |
| $300,000 to $499,999 | 343 |
| $500,000 to $999,999 | 0 |
| $1,000,000 or more | 114 |
| Median (dollars) | 251,300 |
| Owner-occupied units | 2,048 |
| Housing units with a mortgage | 1,503 |
| Housing units without a mortgage | 545 |
| Occupied units paying rent | 591 |
| Less than $500 | 0 |
| $500 to $999 | 0 |
| $1,000 to $1,499 | 60 |
| $1,500 to $1,999 | 531 |
| $2,000 to $2,499 | 0 |
| $2,500 to $2,999 | 0 |
| $3,000 or more | 0 |
| Median (dollars) | 1,722 |
| No rent paid | 0 |
Data is based on 2018 Census
ZIP Codes for other locations
State for PINGREE GROVE
Illinois ZIP CodesOther cities in Illinois