BELLINGHAM, MA ZIP Code
| City | BELLINGHAM |
| State | Massachusetts |
| ZIP Codes count | 1 (see all) |
| Post offices count | 1 (see all) |
| Total population | 4,652 (see all) |
ZIP Code in BELLINGHAM, Massachusetts
02019
This list contains only 5-digit ZIP codes. Use our zip code lookup by address feature to get the full 9-digit (ZIP+4) code.
List of BELLINGHAM, MA ZIP Codes
| ZIP | TYPE | POPU |
|---|---|---|
| 02019 | STANDARD | 16,934 |
Post offices
BELLINGHAM — Post Office™ 111 MECHANIC ST BELLINGHAM, MA 02019-9998 |
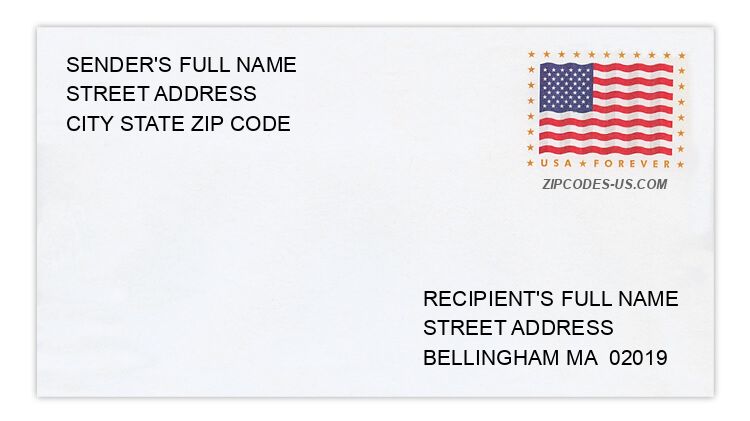
Envelope example
On the bottom center of the envelope, write the address you want your letter delivered to. Include the following on separate lines:
- Recipient's full name
- Full street address
- City, State, and ZIP Code
Using the same format, write the return address in the top left corner.
Using the full ZIP+4 Code when mailing via the USPS ensures the fastest, most accurate mailing possible. If you are not sure of the full 9-digit ZIP Code, use the 5-digit ZIP Code to avoid loss of letter or package.
The recipient address information is provided for your reference.
Address example
76 3RD AVE
BELLINGHAM MA 02019-1443
BELLINGHAM MA 02019-1443
16 GROVE ST
BELLINGHAM MA 02019-1002
BELLINGHAM MA 02019-1002
111 MURON AVE
BELLINGHAM MA 02019-2137
BELLINGHAM MA 02019-2137
21 PINECREST CT
BELLINGHAM MA 02019-2089
BELLINGHAM MA 02019-2089
32 S CENTER ST
BELLINGHAM MA 02019-1741
BELLINGHAM MA 02019-1741
90 SHEILA DR
BELLINGHAM MA 02019-1306
BELLINGHAM MA 02019-1306
Map
Hover over the map to see the ZIP code
Census data for BELLINGHAM, MA
Demographic and housing estimates in BELLINGHAM, MA
| Total population | 4,652 |
| Male | 2,173 |
| Female | 2,479 |
| Total population | 4,652 |
| Under 5 years | 176 |
| 5 to 9 years | 345 |
| 10 to 14 years | 142 |
| 15 to 19 years | 337 |
| 20 to 24 years | 256 |
| 25 to 34 years | 424 |
| 35 to 44 years | 504 |
| 45 to 54 years | 931 |
| 55 to 59 years | 437 |
| 60 to 64 years | 286 |
| 65 to 74 years | 556 |
| 75 to 84 years | 185 |
| 85 years and over | 73 |
| Median age (years) | 46.3 |
| Under 18 years | 867 |
| 16 years and over | 3,972 |
| 18 years and over | 3,785 |
| 21 years and over | 3,652 |
| 62 years and over | 986 |
| 65 years and over | 814 |
| Total population | 4,652 |
| One race | 4,556 |
| White | 4,273 |
| Black or African American | 97 |
| American Indian and Alaska Native | 0 |
| Asian | 52 |
| Native Hawaiian and Other Pacific Islander | 0 |
| Some other race | 134 |
| Two or more races | 96 |
| Citizen, VOTING AGE 18 and over population | 3,651 |
| Male Citizen, VOTING AGE 18 and over population | 1,654 |
| Female Citizen, VOTING AGE 18 and over population | 1,997 |
Social characteristics in BELLINGHAM, MA
| Total households | 1,975 |
| Family households (families) | 1,079 |
| Married-couple family | 914 |
| Male householder, no wife present, family | 11 |
| Female householder, no husband present, family | 154 |
| Nonfamily households | 896 |
| Average household size | 2.35 |
| Average family size | 3.08 |
Economic characteristics in BELLINGHAM, MA
| Total households | 1,975 |
| Less than $10,000 | 71 |
| $10,000 to $14,999 | 93 |
| $15,000 to $24,999 | 185 |
| $25,000 to $34,999 | 161 |
| $35,000 to $49,999 | 219 |
| $50,000 to $74,999 | 214 |
| $75,000 to $99,999 | 271 |
| $100,000 to $149,999 | 321 |
| $150,000 to $199,999 | 240 |
| $200,000 or more | 200 |
| Median household income (dollars) | 85,844 |
Housing characteristics in BELLINGHAM, MA
| Total housing units | 2,147 |
| Occupied housing units | 1,975 |
| Vacant housing units | 172 |
| Total housing units | 2,147 |
| 1-unit, detached | 1,609 |
| 1-unit, attached | 66 |
| 2 units | 51 |
| 3 or 4 units | 17 |
| 5 to 9 units | 105 |
| 10 to 19 units | 11 |
| 20 or more units | 288 |
| Mobile home | 0 |
| Boat, RV, van, etc. | 0 |
| Total housing units | 2,147 |
| Built 2014 or later | 35 |
| Built 2010 to 2013 | 0 |
| Built 2000 to 2009 | 127 |
| Built 1990 to 1999 | 216 |
| Built 1980 to 1989 | 188 |
| Built 1970 to 1979 | 245 |
| Built 1960 to 1969 | 830 |
| Built 1950 to 1959 | 166 |
| Built 1940 to 1949 | 31 |
| Built 1939 or earlier | 309 |
| Total housing units | 2,147 |
| 1 room | 0 |
| 2 rooms | 90 |
| 3 rooms | 244 |
| 4 rooms | 214 |
| 5 rooms | 317 |
| 6 rooms | 475 |
| 7 rooms | 341 |
| 8 rooms | 233 |
| 9 rooms or more | 233 |
| Median rooms | 5.9 |
| Total housing units | 2,147 |
| No bedroom | 0 |
| 1 bedroom | 374 |
| 2 bedrooms | 364 |
| 3 bedrooms | 1,059 |
| 4 bedrooms | 318 |
| 5 or more bedrooms | 32 |
| Occupied housing units | 1,975 |
| Owner-occupied | 1,480 |
| Renter-occupied | 495 |
| Average household size of owner-occupied unit | 2.44 |
| Average household size of renter-occupied unit | 2.09 |
| Occupied housing units | 1,975 |
| Moved in 2017 or later | 0 |
| Moved in 2015 to 2016 | 197 |
| Moved in 2010 to 2014 | 444 |
| Moved in 2000 to 2009 | 463 |
| Moved in 1990 to 1999 | 271 |
| Moved in 1989 and earlier | 600 |
| Owner-occupied units | 1,480 |
| Less than $50,000 | 20 |
| $50,000 to $99,999 | 15 |
| $100,000 to $149,999 | 19 |
| $150,000 to $199,999 | 140 |
| $200,000 to $299,999 | 875 |
| $300,000 to $499,999 | 331 |
| $500,000 to $999,999 | 54 |
| $1,000,000 or more | 26 |
| Median (dollars) | 254,100 |
| Owner-occupied units | 1,480 |
| Housing units with a mortgage | 1,106 |
| Housing units without a mortgage | 374 |
| Occupied units paying rent | 485 |
| Less than $500 | 90 |
| $500 to $999 | 65 |
| $1,000 to $1,499 | 113 |
| $1,500 to $1,999 | 194 |
| $2,000 to $2,499 | 23 |
| $2,500 to $2,999 | 0 |
| $3,000 or more | 0 |
| Median (dollars) | 1,358 |
| No rent paid | 10 |
Data is based on 2018 Census
ZIP Codes for other locations
State for BELLINGHAM
Massachusetts ZIP CodesOther cities in Massachusetts