LYNNFIELD, MA ZIP Code
| City | LYNNFIELD |
| State | Massachusetts |
| ZIP Codes count | 1 (see all) |
| Post offices count | 3 (see all) |
| Total population | 12,847 (see all) |
ZIP Code in LYNNFIELD, Massachusetts
01940
This list contains only 5-digit ZIP codes. Use our zip code lookup by address feature to get the full 9-digit (ZIP+4) code.
List of LYNNFIELD, MA ZIP Codes
| ZIP | TYPE | POPU |
|---|---|---|
| 01940 | STANDARD | 13,023 |
Post offices
LYNNFIELD — Post Office™ 38 SUMMER ST LYNNFIELD, MA 01940-9998 |
SOUTH LYNNFIELD — Post Office™ 598 SALEM ST LYNNFIELD, MA 01940-9992 |
WOBURN — Post Office™ 462 WASHINGTON ST WOBURN, MA 01801-9998 |
Envelope example
On the bottom center of the envelope, write the address you want your letter delivered to. Include the following on separate lines:
- Recipient's full name
- Full street address
- City, State, and ZIP Code
Using the same format, write the return address in the top left corner.
Using the full ZIP+4 Code when mailing via the USPS ensures the fastest, most accurate mailing possible. If you are not sure of the full 9-digit ZIP Code, use the 5-digit ZIP Code to avoid loss of letter or package.
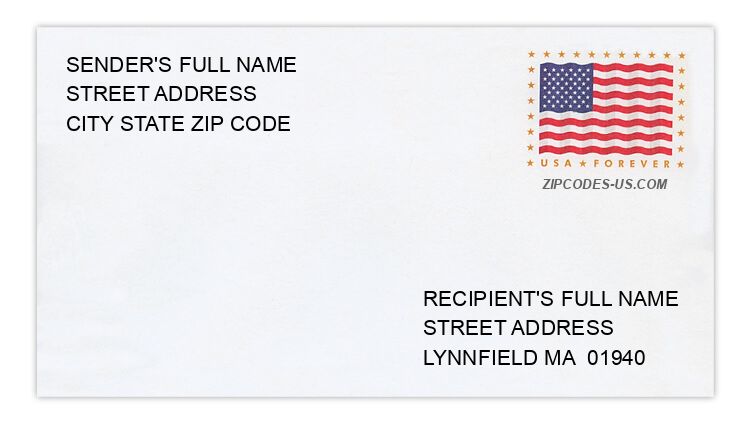
The recipient address information is provided for your reference.
Address example
39 BANCROFT ST
LYNNFIELD MA 01940-2140
LYNNFIELD MA 01940-2140
81 BEECHWOOD RD
LYNNFIELD MA 01940-1965
LYNNFIELD MA 01940-1965
3 CENTER VLG
LYNNFIELD MA 01940-1764
LYNNFIELD MA 01940-1764
45 GIUGLIANO TER
LYNNFIELD MA 01940-1358
LYNNFIELD MA 01940-1358
41 GLEN DR
LYNNFIELD MA 01940-1056
LYNNFIELD MA 01940-1056
35 GRAYLAND RD
LYNNFIELD MA 01940-1754
LYNNFIELD MA 01940-1754
Map
Hover over the map to see the ZIP code
Census data for LYNNFIELD, MA
Demographic and housing estimates in LYNNFIELD, MA
| Total population | 12,847 |
| Male | 5,944 |
| Female | 6,903 |
| Total population | 12,847 |
| Under 5 years | 792 |
| 5 to 9 years | 940 |
| 10 to 14 years | 982 |
| 15 to 19 years | 704 |
| 20 to 24 years | 710 |
| 25 to 34 years | 1,075 |
| 35 to 44 years | 1,327 |
| 45 to 54 years | 2,206 |
| 55 to 59 years | 1,041 |
| 60 to 64 years | 660 |
| 65 to 74 years | 1,184 |
| 75 to 84 years | 837 |
| 85 years and over | 389 |
| Median age (years) | 43.9 |
| Under 18 years | 3,160 |
| 16 years and over | 9,954 |
| 18 years and over | 9,687 |
| 21 years and over | 9,308 |
| 62 years and over | 2,770 |
| 65 years and over | 2,410 |
| Total population | 12,847 |
| One race | 12,578 |
| White | 11,725 |
| Black or African American | 217 |
| American Indian and Alaska Native | 0 |
| Asian | 635 |
| Native Hawaiian and Other Pacific Islander | 0 |
| Some other race | 1 |
| Two or more races | 269 |
| Citizen, VOTING AGE 18 and over population | 9,491 |
| Male Citizen, VOTING AGE 18 and over population | 4,491 |
| Female Citizen, VOTING AGE 18 and over population | 5,000 |
Social characteristics in LYNNFIELD, MA
| Total households | 4,496 |
| Family households (families) | 3,535 |
| Married-couple family | 3,129 |
| Male householder, no wife present, family | 131 |
| Female householder, no husband present, family | 275 |
| Nonfamily households | 961 |
| Average household size | 2.85 |
| Average family size | 3.31 |
Economic characteristics in LYNNFIELD, MA
| Total households | 4,496 |
| Less than $10,000 | 70 |
| $10,000 to $14,999 | 34 |
| $15,000 to $24,999 | 182 |
| $25,000 to $34,999 | 207 |
| $35,000 to $49,999 | 238 |
| $50,000 to $74,999 | 593 |
| $75,000 to $99,999 | 403 |
| $100,000 to $149,999 | 821 |
| $150,000 to $199,999 | 734 |
| $200,000 or more | 1,214 |
| Median household income (dollars) | 132,632 |
Housing characteristics in LYNNFIELD, MA
| Total housing units | 4,767 |
| Occupied housing units | 4,496 |
| Vacant housing units | 271 |
| Total housing units | 4,767 |
| 1-unit, detached | 3,935 |
| 1-unit, attached | 133 |
| 2 units | 39 |
| 3 or 4 units | 103 |
| 5 to 9 units | 61 |
| 10 to 19 units | 39 |
| 20 or more units | 457 |
| Mobile home | 0 |
| Boat, RV, van, etc. | 0 |
| Total housing units | 4,767 |
| Built 2014 or later | 110 |
| Built 2010 to 2013 | 116 |
| Built 2000 to 2009 | 499 |
| Built 1990 to 1999 | 228 |
| Built 1980 to 1989 | 336 |
| Built 1970 to 1979 | 480 |
| Built 1960 to 1969 | 1,094 |
| Built 1950 to 1959 | 1,107 |
| Built 1940 to 1949 | 419 |
| Built 1939 or earlier | 378 |
| Total housing units | 4,767 |
| 1 room | 145 |
| 2 rooms | 166 |
| 3 rooms | 161 |
| 4 rooms | 188 |
| 5 rooms | 236 |
| 6 rooms | 707 |
| 7 rooms | 764 |
| 8 rooms | 1,044 |
| 9 rooms or more | 1,356 |
| Median rooms | 7.5 |
| Total housing units | 4,767 |
| No bedroom | 145 |
| 1 bedroom | 331 |
| 2 bedrooms | 632 |
| 3 bedrooms | 1,674 |
| 4 bedrooms | 1,575 |
| 5 or more bedrooms | 410 |
| Occupied housing units | 4,496 |
| Owner-occupied | 3,937 |
| Renter-occupied | 559 |
| Average household size of owner-occupied unit | 3.04 |
| Average household size of renter-occupied unit | 1.55 |
| Occupied housing units | 4,496 |
| Moved in 2017 or later | 114 |
| Moved in 2015 to 2016 | 443 |
| Moved in 2010 to 2014 | 1,008 |
| Moved in 2000 to 2009 | 1,069 |
| Moved in 1990 to 1999 | 793 |
| Moved in 1989 and earlier | 1,069 |
| Owner-occupied units | 3,937 |
| Less than $50,000 | 21 |
| $50,000 to $99,999 | 0 |
| $100,000 to $149,999 | 0 |
| $150,000 to $199,999 | 66 |
| $200,000 to $299,999 | 68 |
| $300,000 to $499,999 | 759 |
| $500,000 to $999,999 | 2,701 |
| $1,000,000 or more | 322 |
| Median (dollars) | 647,200 |
| Owner-occupied units | 3,937 |
| Housing units with a mortgage | 2,743 |
| Housing units without a mortgage | 1,194 |
| Occupied units paying rent | 559 |
| Less than $500 | 60 |
| $500 to $999 | 82 |
| $1,000 to $1,499 | 89 |
| $1,500 to $1,999 | 33 |
| $2,000 to $2,499 | 98 |
| $2,500 to $2,999 | 120 |
| $3,000 or more | 77 |
| Median (dollars) | 2,079 |
| No rent paid | 0 |
Data is based on 2018 Census
ZIP Codes for other locations
State for LYNNFIELD
Massachusetts ZIP CodesOther cities in Massachusetts