NEEDHAM, MA ZIP Code
| City | NEEDHAM |
| State | Massachusetts |
| ZIP Codes count | 2 (see all) |
| Post offices count | 2 (see all) |
| Total population | 30,735 (see all) |
ZIP Codes in NEEDHAM, Massachusetts
02492, 02494
This list contains only 5-digit ZIP codes. Use our zip code lookup by address feature to get the full 9-digit (ZIP+4) code.
List of NEEDHAM, MA ZIP Codes
| ZIP | TYPE | POPU |
|---|---|---|
| 02492 | STANDARD | 20,927 |
| 02494 | STANDARD | 10,881 |
Post offices
NEEDHAM — Post Office™ 1150 GREAT PLAIN AVE NEEDHAM, MA 02492-9998 |
NEEDHAM HEIGHTS — Post Office™ 844 HIGHLAND AVE NEEDHAM HEIGHTS, MA 02494-9998 |
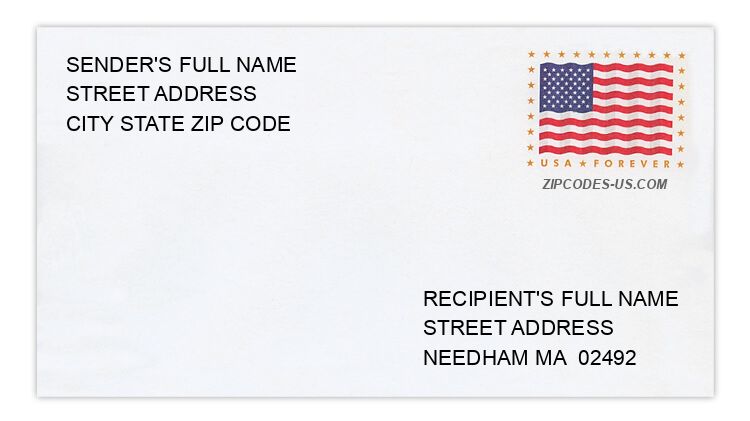
Envelope example
On the bottom center of the envelope, write the address you want your letter delivered to. Include the following on separate lines:
- Recipient's full name
- Full street address
- City, State, and ZIP Code
Using the same format, write the return address in the top left corner.
Using the full ZIP+4 Code when mailing via the USPS ensures the fastest, most accurate mailing possible. If you are not sure of the full 9-digit ZIP Code, use the 5-digit ZIP Code to avoid loss of letter or package.
The recipient address information is provided for your reference.
Address example
89 ALPINE TER
NEEDHAM MA 02492-3917
NEEDHAM MA 02492-3917
196 BELLE LN
NEEDHAM MA 02492-1560
NEEDHAM MA 02492-1560
39 COLBY ST
NEEDHAM MA 02492-4054
NEEDHAM MA 02492-4054
35 HEATH ST
NEEDHAM MA 02492-3231
NEEDHAM MA 02492-3231
171 LAUREL DR
NEEDHAM MA 02492-3206
NEEDHAM MA 02492-3206
16 PLYMOUTH RD
NEEDHAM MA 02492-3715
NEEDHAM MA 02492-3715
Map
Hover over the map to see the ZIP code
Census data for NEEDHAM, MA
Demographic and housing estimates in NEEDHAM, MA
| Total population | 30,735 |
| Male | 14,620 |
| Female | 16,115 |
| Total population | 30,735 |
| Under 5 years | 1,597 |
| 5 to 9 years | 2,488 |
| 10 to 14 years | 2,503 |
| 15 to 19 years | 2,406 |
| 20 to 24 years | 1,491 |
| 25 to 34 years | 1,760 |
| 35 to 44 years | 3,960 |
| 45 to 54 years | 4,679 |
| 55 to 59 years | 2,355 |
| 60 to 64 years | 1,936 |
| 65 to 74 years | 3,044 |
| 75 to 84 years | 1,557 |
| 85 years and over | 959 |
| Median age (years) | 43.4 |
| Under 18 years | 8,231 |
| 16 years and over | 23,678 |
| 18 years and over | 22,504 |
| 21 years and over | 21,381 |
| 62 years and over | 6,536 |
| 65 years and over | 5,560 |
| Total population | 30,735 |
| One race | 30,043 |
| White | 26,263 |
| Black or African American | 967 |
| American Indian and Alaska Native | 24 |
| Asian | 2,648 |
| Native Hawaiian and Other Pacific Islander | 0 |
| Some other race | 141 |
| Two or more races | 692 |
| Citizen, VOTING AGE 18 and over population | 21,458 |
| Male Citizen, VOTING AGE 18 and over population | 9,970 |
| Female Citizen, VOTING AGE 18 and over population | 11,488 |
Social characteristics in NEEDHAM, MA
| Total households | 10,765 |
| Family households (families) | 8,370 |
| Married-couple family | 7,448 |
| Male householder, no wife present, family | 268 |
| Female householder, no husband present, family | 654 |
| Nonfamily households | 2,395 |
| Average household size | 2.77 |
| Average family size | 3.23 |
Economic characteristics in NEEDHAM, MA
| Total households | 10,765 |
| Less than $10,000 | 266 |
| $10,000 to $14,999 | 225 |
| $15,000 to $24,999 | 318 |
| $25,000 to $34,999 | 455 |
| $35,000 to $49,999 | 374 |
| $50,000 to $74,999 | 989 |
| $75,000 to $99,999 | 805 |
| $100,000 to $149,999 | 1,881 |
| $150,000 to $199,999 | 1,628 |
| $200,000 or more | 3,824 |
| Median household income (dollars) | 153,032 |
Housing characteristics in NEEDHAM, MA
| Total housing units | 11,222 |
| Occupied housing units | 10,765 |
| Vacant housing units | 457 |
| Total housing units | 11,222 |
| 1-unit, detached | 8,518 |
| 1-unit, attached | 540 |
| 2 units | 502 |
| 3 or 4 units | 223 |
| 5 to 9 units | 207 |
| 10 to 19 units | 170 |
| 20 or more units | 1,062 |
| Mobile home | 0 |
| Boat, RV, van, etc. | 0 |
| Total housing units | 11,222 |
| Built 2014 or later | 319 |
| Built 2010 to 2013 | 441 |
| Built 2000 to 2009 | 903 |
| Built 1990 to 1999 | 550 |
| Built 1980 to 1989 | 914 |
| Built 1970 to 1979 | 721 |
| Built 1960 to 1969 | 1,219 |
| Built 1950 to 1959 | 2,279 |
| Built 1940 to 1949 | 1,313 |
| Built 1939 or earlier | 2,563 |
| Total housing units | 11,222 |
| 1 room | 232 |
| 2 rooms | 219 |
| 3 rooms | 508 |
| 4 rooms | 767 |
| 5 rooms | 765 |
| 6 rooms | 1,391 |
| 7 rooms | 1,757 |
| 8 rooms | 1,953 |
| 9 rooms or more | 3,630 |
| Median rooms | 7.5 |
| Total housing units | 11,222 |
| No bedroom | 232 |
| 1 bedroom | 735 |
| 2 bedrooms | 1,344 |
| 3 bedrooms | 3,821 |
| 4 bedrooms | 3,664 |
| 5 or more bedrooms | 1,426 |
| Occupied housing units | 10,765 |
| Owner-occupied | 8,948 |
| Renter-occupied | 1,817 |
| Average household size of owner-occupied unit | 2.98 |
| Average household size of renter-occupied unit | 1.73 |
| Occupied housing units | 10,765 |
| Moved in 2017 or later | 376 |
| Moved in 2015 to 2016 | 957 |
| Moved in 2010 to 2014 | 2,452 |
| Moved in 2000 to 2009 | 2,926 |
| Moved in 1990 to 1999 | 1,842 |
| Moved in 1989 and earlier | 2,212 |
| Owner-occupied units | 8,948 |
| Less than $50,000 | 59 |
| $50,000 to $99,999 | 31 |
| $100,000 to $149,999 | 5 |
| $150,000 to $199,999 | 15 |
| $200,000 to $299,999 | 228 |
| $300,000 to $499,999 | 522 |
| $500,000 to $999,999 | 5,700 |
| $1,000,000 or more | 2,388 |
| Median (dollars) | 805,000 |
| Owner-occupied units | 8,948 |
| Housing units with a mortgage | 5,874 |
| Housing units without a mortgage | 3,074 |
| Occupied units paying rent | 1,703 |
| Less than $500 | 292 |
| $500 to $999 | 280 |
| $1,000 to $1,499 | 302 |
| $1,500 to $1,999 | 346 |
| $2,000 to $2,499 | 219 |
| $2,500 to $2,999 | 43 |
| $3,000 or more | 221 |
| Median (dollars) | 1,473 |
| No rent paid | 114 |
Data is based on 2018 Census
ZIP Codes for other locations
State for NEEDHAM
Massachusetts ZIP CodesOther cities in Massachusetts