PITTSFIELD, MA ZIP Code
| City | PITTSFIELD |
| State | Massachusetts |
| ZIP Codes count | 3 (see all) |
| Post offices count | 1 (see all) |
| Total population | 43,058 (see all) |
ZIP Codes in PITTSFIELD, Massachusetts
01201, 01202, 01203
This list contains only 5-digit ZIP codes. Use our zip code lookup by address feature to get the full 9-digit (ZIP+4) code.
List of PITTSFIELD, MA ZIP Codes
| ZIP | TYPE | POPU |
|---|---|---|
| 01201 | STANDARD | 45,372 |
| 01202 | PO BOX | – |
| 01203 | PO BOX | – |
Post offices
PITTSFIELD — Post Office™ 212 FENN ST PITTSFIELD, MA 01201-9998 |
Envelope example
On the bottom center of the envelope, write the address you want your letter delivered to. Include the following on separate lines:
- Recipient's full name
- Full street address
- City, State, and ZIP Code
Using the same format, write the return address in the top left corner.
Using the full ZIP+4 Code when mailing via the USPS ensures the fastest, most accurate mailing possible. If you are not sure of the full 9-digit ZIP Code, use the 5-digit ZIP Code to avoid loss of letter or package.
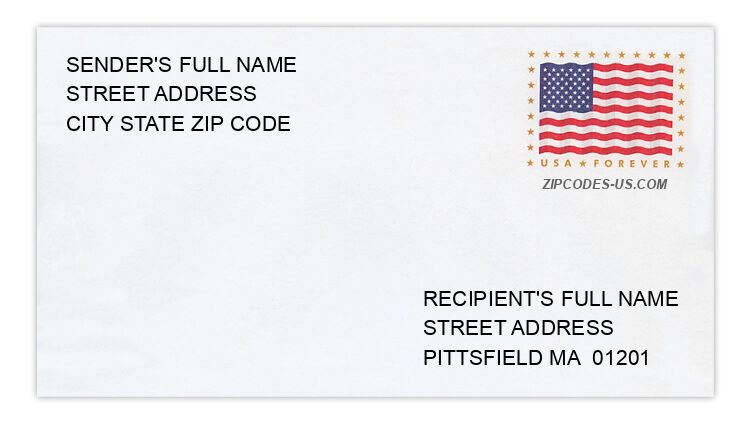
The recipient address information is provided for your reference.
Address example
27 DAYTONA AVE
PITTSFIELD MA 01201-2209
PITTSFIELD MA 01201-2209
10 HARRIS ST
PITTSFIELD MA 01201-6737
PITTSFIELD MA 01201-6737
1078 NORTH ST
PITTSFIELD MA 01201-1522
PITTSFIELD MA 01201-1522
73 OLD FARM LN
PITTSFIELD MA 01201-9157
PITTSFIELD MA 01201-9157
9 ROCKLAND DR
PITTSFIELD MA 01201-8418
PITTSFIELD MA 01201-8418
53 S JOHN ST
PITTSFIELD MA 01201-5008
PITTSFIELD MA 01201-5008
Map
Hover over the map to see the ZIP code
Census data for PITTSFIELD, MA
Demographic and housing estimates in PITTSFIELD, MA
| Total population | 43,058 |
| Male | 20,605 |
| Female | 22,453 |
| Total population | 43,058 |
| Under 5 years | 2,260 |
| 5 to 9 years | 2,241 |
| 10 to 14 years | 2,311 |
| 15 to 19 years | 2,126 |
| 20 to 24 years | 2,706 |
| 25 to 34 years | 5,624 |
| 35 to 44 years | 5,130 |
| 45 to 54 years | 6,021 |
| 55 to 59 years | 3,509 |
| 60 to 64 years | 2,922 |
| 65 to 74 years | 4,556 |
| 75 to 84 years | 2,454 |
| 85 years and over | 1,198 |
| Median age (years) | 43.7 |
| Under 18 years | 8,117 |
| 16 years and over | 35,799 |
| 18 years and over | 34,941 |
| 21 years and over | 33,500 |
| 62 years and over | 9,977 |
| 65 years and over | 8,208 |
| Total population | 43,058 |
| One race | 41,684 |
| White | 37,442 |
| Black or African American | 2,156 |
| American Indian and Alaska Native | 147 |
| Asian | 848 |
| Native Hawaiian and Other Pacific Islander | 25 |
| Some other race | 1,066 |
| Two or more races | 1,374 |
| Citizen, VOTING AGE 18 and over population | 33,663 |
| Male Citizen, VOTING AGE 18 and over population | 15,914 |
| Female Citizen, VOTING AGE 18 and over population | 17,749 |
Social characteristics in PITTSFIELD, MA
| Total households | 19,230 |
| Family households (families) | 10,884 |
| Married-couple family | 7,044 |
| Male householder, no wife present, family | 850 |
| Female householder, no husband present, family | 2,990 |
| Nonfamily households | 8,346 |
| Average household size | 2.18 |
| Average family size | 2.85 |
Economic characteristics in PITTSFIELD, MA
| Total households | 19,230 |
| Less than $10,000 | 1,397 |
| $10,000 to $14,999 | 1,245 |
| $15,000 to $24,999 | 2,513 |
| $25,000 to $34,999 | 2,051 |
| $35,000 to $49,999 | 2,691 |
| $50,000 to $74,999 | 3,082 |
| $75,000 to $99,999 | 2,127 |
| $100,000 to $149,999 | 2,663 |
| $150,000 to $199,999 | 820 |
| $200,000 or more | 641 |
| Median household income (dollars) | 48,555 |
Housing characteristics in PITTSFIELD, MA
| Total housing units | 21,407 |
| Occupied housing units | 19,230 |
| Vacant housing units | 2,177 |
| Total housing units | 21,407 |
| 1-unit, detached | 11,279 |
| 1-unit, attached | 948 |
| 2 units | 3,216 |
| 3 or 4 units | 2,577 |
| 5 to 9 units | 1,013 |
| 10 to 19 units | 910 |
| 20 or more units | 1,268 |
| Mobile home | 196 |
| Boat, RV, van, etc. | 0 |
| Total housing units | 21,407 |
| Built 2014 or later | 24 |
| Built 2010 to 2013 | 306 |
| Built 2000 to 2009 | 596 |
| Built 1990 to 1999 | 745 |
| Built 1980 to 1989 | 1,606 |
| Built 1970 to 1979 | 1,662 |
| Built 1960 to 1969 | 1,889 |
| Built 1950 to 1959 | 3,044 |
| Built 1940 to 1949 | 2,159 |
| Built 1939 or earlier | 9,376 |
| Total housing units | 21,407 |
| 1 room | 629 |
| 2 rooms | 420 |
| 3 rooms | 2,180 |
| 4 rooms | 3,099 |
| 5 rooms | 4,223 |
| 6 rooms | 4,494 |
| 7 rooms | 2,662 |
| 8 rooms | 2,159 |
| 9 rooms or more | 1,541 |
| Median rooms | 5.5 |
| Total housing units | 21,407 |
| No bedroom | 691 |
| 1 bedroom | 3,044 |
| 2 bedrooms | 5,670 |
| 3 bedrooms | 8,414 |
| 4 bedrooms | 3,101 |
| 5 or more bedrooms | 487 |
| Occupied housing units | 19,230 |
| Owner-occupied | 11,713 |
| Renter-occupied | 7,517 |
| Average household size of owner-occupied unit | 2.33 |
| Average household size of renter-occupied unit | 1.95 |
| Occupied housing units | 19,230 |
| Moved in 2017 or later | 664 |
| Moved in 2015 to 2016 | 1,830 |
| Moved in 2010 to 2014 | 5,558 |
| Moved in 2000 to 2009 | 5,259 |
| Moved in 1990 to 1999 | 2,215 |
| Moved in 1989 and earlier | 3,704 |
| Owner-occupied units | 11,713 |
| Less than $50,000 | 269 |
| $50,000 to $99,999 | 788 |
| $100,000 to $149,999 | 2,735 |
| $150,000 to $199,999 | 3,553 |
| $200,000 to $299,999 | 2,400 |
| $300,000 to $499,999 | 1,389 |
| $500,000 to $999,999 | 473 |
| $1,000,000 or more | 106 |
| Median (dollars) | 172,600 |
| Owner-occupied units | 11,713 |
| Housing units with a mortgage | 7,828 |
| Housing units without a mortgage | 3,885 |
| Occupied units paying rent | 7,267 |
| Less than $500 | 1,399 |
| $500 to $999 | 3,853 |
| $1,000 to $1,499 | 1,606 |
| $1,500 to $1,999 | 365 |
| $2,000 to $2,499 | 44 |
| $2,500 to $2,999 | 0 |
| $3,000 or more | 0 |
| Median (dollars) | 852 |
| No rent paid | 250 |
Data is based on 2018 Census
ZIP Codes for other locations
State for PITTSFIELD
Massachusetts ZIP CodesOther cities in Massachusetts