PLYMOUTH, MA ZIP Code
| City | PLYMOUTH |
| State | Massachusetts |
| ZIP Codes count | 3 (see all) |
| Post offices count | 3 (see all) |
| Total population | 7,122 (see all) |
ZIP Codes in PLYMOUTH, Massachusetts
02360, 02361, 02362
This list contains only 5-digit ZIP codes. Use our zip code lookup by address feature to get the full 9-digit (ZIP+4) code.
List of PLYMOUTH, MA ZIP Codes
| ZIP | TYPE | POPU |
|---|---|---|
| 02360 | STANDARD | 60,793 |
| 02361 | PO BOX | – |
| 02362 | PO BOX | – |
Post offices
CENTER — Post Office™ 6 MAIN STREET EXT PLYMOUTH, MA 02361-9998 |
NORTH PLYMOUTH — Post Office™ 283 COURT ST PLYMOUTH, MA 02362-9998 |
PLYMOUTH — Post Office™ 100 LONG POND RD PLYMOUTH, MA 02360-9998 |
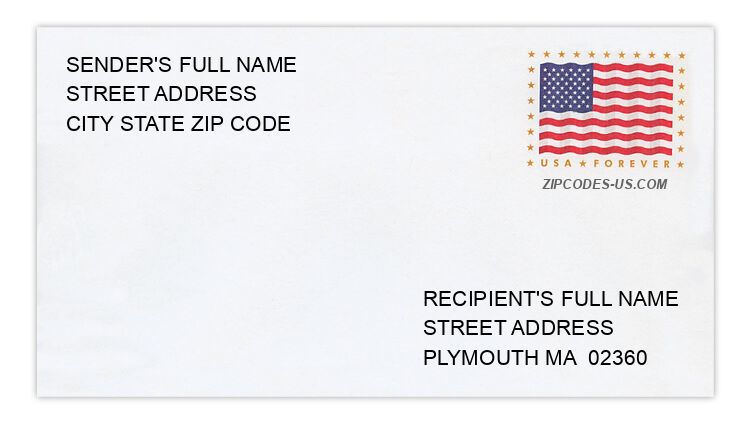
Envelope example
On the bottom center of the envelope, write the address you want your letter delivered to. Include the following on separate lines:
- Recipient's full name
- Full street address
- City, State, and ZIP Code
Using the same format, write the return address in the top left corner.
Using the full ZIP+4 Code when mailing via the USPS ensures the fastest, most accurate mailing possible. If you are not sure of the full 9-digit ZIP Code, use the 5-digit ZIP Code to avoid loss of letter or package.
The recipient address information is provided for your reference.
Address example
69 CEDAR TER
PLYMOUTH MA 02360-1905
PLYMOUTH MA 02360-1905
67 COLUMBUS RD
PLYMOUTH MA 02360-4810
PLYMOUTH MA 02360-4810
45 E BAY LN
PLYMOUTH MA 02360-6401
PLYMOUTH MA 02360-6401
3 NICKERSON ST
PLYMOUTH MA 02360-5656
PLYMOUTH MA 02360-5656
58 WELLINGTON RD
PLYMOUTH MA 02360-2059
PLYMOUTH MA 02360-2059
42 WHITLEY TRL
PLYMOUTH MA 02360-2861
PLYMOUTH MA 02360-2861
Map
Hover over the map to see the ZIP code
Census data for PLYMOUTH, MA
Demographic and housing estimates in PLYMOUTH, MA
| Total population | 7,122 |
| Male | 3,299 |
| Female | 3,823 |
| Total population | 7,122 |
| Under 5 years | 475 |
| 5 to 9 years | 229 |
| 10 to 14 years | 265 |
| 15 to 19 years | 331 |
| 20 to 24 years | 345 |
| 25 to 34 years | 1,164 |
| 35 to 44 years | 781 |
| 45 to 54 years | 967 |
| 55 to 59 years | 512 |
| 60 to 64 years | 548 |
| 65 to 74 years | 904 |
| 75 to 84 years | 438 |
| 85 years and over | 163 |
| Median age (years) | 44.7 |
| Under 18 years | 1,204 |
| 16 years and over | 6,079 |
| 18 years and over | 5,918 |
| 21 years and over | 5,784 |
| 62 years and over | 1,889 |
| 65 years and over | 1,505 |
| Total population | 7,122 |
| One race | 6,921 |
| White | 6,368 |
| Black or African American | 137 |
| American Indian and Alaska Native | 0 |
| Asian | 91 |
| Native Hawaiian and Other Pacific Islander | 0 |
| Some other race | 325 |
| Two or more races | 201 |
| Citizen, VOTING AGE 18 and over population | 5,545 |
| Male Citizen, VOTING AGE 18 and over population | 2,493 |
| Female Citizen, VOTING AGE 18 and over population | 3,052 |
Social characteristics in PLYMOUTH, MA
| Total households | 3,298 |
| Family households (families) | 1,808 |
| Married-couple family | 1,017 |
| Male householder, no wife present, family | 272 |
| Female householder, no husband present, family | 519 |
| Nonfamily households | 1,490 |
| Average household size | 2.10 |
| Average family size | 2.80 |
Economic characteristics in PLYMOUTH, MA
| Total households | 3,298 |
| Less than $10,000 | 156 |
| $10,000 to $14,999 | 225 |
| $15,000 to $24,999 | 194 |
| $25,000 to $34,999 | 292 |
| $35,000 to $49,999 | 454 |
| $50,000 to $74,999 | 754 |
| $75,000 to $99,999 | 418 |
| $100,000 to $149,999 | 363 |
| $150,000 to $199,999 | 230 |
| $200,000 or more | 212 |
| Median household income (dollars) | 61,111 |
Housing characteristics in PLYMOUTH, MA
| Total housing units | 3,991 |
| Occupied housing units | 3,298 |
| Vacant housing units | 693 |
| Total housing units | 3,991 |
| 1-unit, detached | 1,581 |
| 1-unit, attached | 325 |
| 2 units | 677 |
| 3 or 4 units | 457 |
| 5 to 9 units | 254 |
| 10 to 19 units | 354 |
| 20 or more units | 343 |
| Mobile home | 0 |
| Boat, RV, van, etc. | 0 |
| Total housing units | 3,991 |
| Built 2014 or later | 49 |
| Built 2010 to 2013 | 10 |
| Built 2000 to 2009 | 142 |
| Built 1990 to 1999 | 112 |
| Built 1980 to 1989 | 251 |
| Built 1970 to 1979 | 568 |
| Built 1960 to 1969 | 455 |
| Built 1950 to 1959 | 190 |
| Built 1940 to 1949 | 211 |
| Built 1939 or earlier | 2,003 |
| Total housing units | 3,991 |
| 1 room | 103 |
| 2 rooms | 71 |
| 3 rooms | 722 |
| 4 rooms | 930 |
| 5 rooms | 834 |
| 6 rooms | 492 |
| 7 rooms | 399 |
| 8 rooms | 246 |
| 9 rooms or more | 194 |
| Median rooms | 4.7 |
| Total housing units | 3,991 |
| No bedroom | 103 |
| 1 bedroom | 890 |
| 2 bedrooms | 1,346 |
| 3 bedrooms | 1,232 |
| 4 bedrooms | 336 |
| 5 or more bedrooms | 84 |
| Occupied housing units | 3,298 |
| Owner-occupied | 1,651 |
| Renter-occupied | 1,647 |
| Average household size of owner-occupied unit | 2.29 |
| Average household size of renter-occupied unit | 1.91 |
| Occupied housing units | 3,298 |
| Moved in 2017 or later | 223 |
| Moved in 2015 to 2016 | 360 |
| Moved in 2010 to 2014 | 920 |
| Moved in 2000 to 2009 | 736 |
| Moved in 1990 to 1999 | 487 |
| Moved in 1989 and earlier | 572 |
| Owner-occupied units | 1,651 |
| Less than $50,000 | 29 |
| $50,000 to $99,999 | 0 |
| $100,000 to $149,999 | 0 |
| $150,000 to $199,999 | 124 |
| $200,000 to $299,999 | 359 |
| $300,000 to $499,999 | 961 |
| $500,000 to $999,999 | 136 |
| $1,000,000 or more | 42 |
| Median (dollars) | 343,200 |
| Owner-occupied units | 1,651 |
| Housing units with a mortgage | 1,282 |
| Housing units without a mortgage | 369 |
| Occupied units paying rent | 1,548 |
| Less than $500 | 160 |
| $500 to $999 | 263 |
| $1,000 to $1,499 | 734 |
| $1,500 to $1,999 | 306 |
| $2,000 to $2,499 | 69 |
| $2,500 to $2,999 | 16 |
| $3,000 or more | 0 |
| Median (dollars) | 1,245 |
| No rent paid | 99 |
Data is based on 2018 Census
ZIP Codes for other locations
State for PLYMOUTH
Massachusetts ZIP CodesOther cities in Massachusetts