RUTLAND, MA ZIP Code
| City | RUTLAND |
| State | Massachusetts |
| ZIP Codes count | 1 (see all) |
| Post offices count | 1 (see all) |
| Total population | 2,121 (see all) |
ZIP Code in RUTLAND, Massachusetts
01543
This list contains only 5-digit ZIP codes. Use our zip code lookup by address feature to get the full 9-digit (ZIP+4) code.
List of RUTLAND, MA ZIP Codes
| ZIP | TYPE | POPU |
|---|---|---|
| 01543 | STANDARD | 8,988 |
Post offices
RUTLAND — Post Office™ 26 MAPLE AVE RUTLAND, MA 01543-9998 |
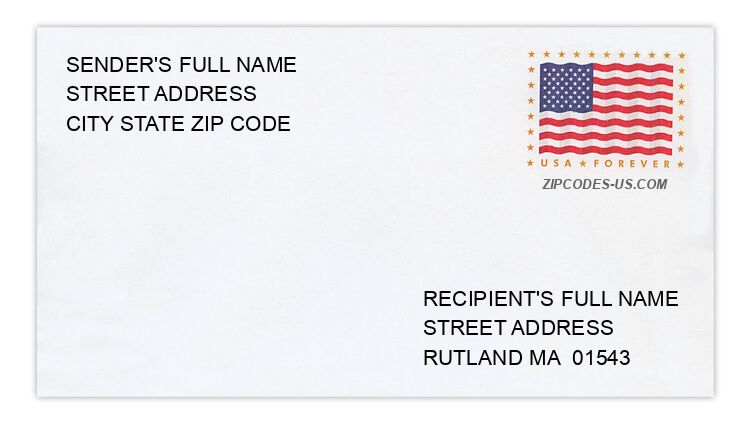
Envelope example
On the bottom center of the envelope, write the address you want your letter delivered to. Include the following on separate lines:
- Recipient's full name
- Full street address
- City, State, and ZIP Code
Using the same format, write the return address in the top left corner.
Using the full ZIP+4 Code when mailing via the USPS ensures the fastest, most accurate mailing possible. If you are not sure of the full 9-digit ZIP Code, use the 5-digit ZIP Code to avoid loss of letter or package.
The recipient address information is provided for your reference.
Address example
33 CRESTVIEW DR
RUTLAND MA 01543-1629
RUTLAND MA 01543-1629
34 HELEN AVE
RUTLAND MA 01543-2114
RUTLAND MA 01543-2114
99 MILLBROOK ST
RUTLAND MA 01543-1451
RUTLAND MA 01543-1451
54 ORCHARD HILL DR
RUTLAND MA 01543-1778
RUTLAND MA 01543-1778
92 PRESCOTT ST
RUTLAND MA 01543-1721
RUTLAND MA 01543-1721
160 WACHUSETT ST
RUTLAND MA 01543-2001
RUTLAND MA 01543-2001
Map
Hover over the map to see the ZIP code
Census data for RUTLAND, MA
Demographic and housing estimates in RUTLAND, MA
| Total population | 2,121 |
| Male | 1,211 |
| Female | 910 |
| Total population | 2,121 |
| Under 5 years | 154 |
| 5 to 9 years | 44 |
| 10 to 14 years | 112 |
| 15 to 19 years | 161 |
| 20 to 24 years | 16 |
| 25 to 34 years | 291 |
| 35 to 44 years | 356 |
| 45 to 54 years | 414 |
| 55 to 59 years | 102 |
| 60 to 64 years | 123 |
| 65 to 74 years | 238 |
| 75 to 84 years | 99 |
| 85 years and over | 11 |
| Median age (years) | 41.9 |
| Under 18 years | 401 |
| 16 years and over | 1,811 |
| 18 years and over | 1,720 |
| 21 years and over | 1,650 |
| 62 years and over | 470 |
| 65 years and over | 348 |
| Total population | 2,121 |
| One race | 2,121 |
| White | 2,066 |
| Black or African American | 0 |
| American Indian and Alaska Native | 0 |
| Asian | 55 |
| Native Hawaiian and Other Pacific Islander | 0 |
| Some other race | 0 |
| Two or more races | 0 |
| Citizen, VOTING AGE 18 and over population | 1,720 |
| Male Citizen, VOTING AGE 18 and over population | 981 |
| Female Citizen, VOTING AGE 18 and over population | 739 |
Social characteristics in RUTLAND, MA
| Total households | 868 |
| Family households (families) | 633 |
| Married-couple family | 495 |
| Male householder, no wife present, family | 20 |
| Female householder, no husband present, family | 118 |
| Nonfamily households | 235 |
| Average household size | 2.42 |
| Average family size | 2.89 |
Economic characteristics in RUTLAND, MA
| Total households | 868 |
| Less than $10,000 | 14 |
| $10,000 to $14,999 | 13 |
| $15,000 to $24,999 | 0 |
| $25,000 to $34,999 | 78 |
| $35,000 to $49,999 | 166 |
| $50,000 to $74,999 | 162 |
| $75,000 to $99,999 | 145 |
| $100,000 to $149,999 | 212 |
| $150,000 to $199,999 | 53 |
| $200,000 or more | 25 |
| Median household income (dollars) | 75,053 |
Housing characteristics in RUTLAND, MA
| Total housing units | 982 |
| Occupied housing units | 868 |
| Vacant housing units | 114 |
| Total housing units | 982 |
| 1-unit, detached | 705 |
| 1-unit, attached | 0 |
| 2 units | 20 |
| 3 or 4 units | 165 |
| 5 to 9 units | 0 |
| 10 to 19 units | 0 |
| 20 or more units | 13 |
| Mobile home | 79 |
| Boat, RV, van, etc. | 0 |
| Total housing units | 982 |
| Built 2014 or later | 0 |
| Built 2010 to 2013 | 0 |
| Built 2000 to 2009 | 39 |
| Built 1990 to 1999 | 73 |
| Built 1980 to 1989 | 53 |
| Built 1970 to 1979 | 253 |
| Built 1960 to 1969 | 148 |
| Built 1950 to 1959 | 127 |
| Built 1940 to 1949 | 24 |
| Built 1939 or earlier | 265 |
| Total housing units | 982 |
| 1 room | 0 |
| 2 rooms | 0 |
| 3 rooms | 100 |
| 4 rooms | 213 |
| 5 rooms | 153 |
| 6 rooms | 264 |
| 7 rooms | 83 |
| 8 rooms | 134 |
| 9 rooms or more | 35 |
| Median rooms | 5.6 |
| Total housing units | 982 |
| No bedroom | 0 |
| 1 bedroom | 228 |
| 2 bedrooms | 244 |
| 3 bedrooms | 379 |
| 4 bedrooms | 131 |
| 5 or more bedrooms | 0 |
| Occupied housing units | 868 |
| Owner-occupied | 594 |
| Renter-occupied | 274 |
| Average household size of owner-occupied unit | 2.74 |
| Average household size of renter-occupied unit | 1.73 |
| Occupied housing units | 868 |
| Moved in 2017 or later | 0 |
| Moved in 2015 to 2016 | 177 |
| Moved in 2010 to 2014 | 123 |
| Moved in 2000 to 2009 | 221 |
| Moved in 1990 to 1999 | 77 |
| Moved in 1989 and earlier | 270 |
| Owner-occupied units | 594 |
| Less than $50,000 | 14 |
| $50,000 to $99,999 | 0 |
| $100,000 to $149,999 | 54 |
| $150,000 to $199,999 | 183 |
| $200,000 to $299,999 | 295 |
| $300,000 to $499,999 | 48 |
| $500,000 to $999,999 | 0 |
| $1,000,000 or more | 0 |
| Median (dollars) | 218,700 |
| Owner-occupied units | 594 |
| Housing units with a mortgage | 417 |
| Housing units without a mortgage | 177 |
| Occupied units paying rent | 274 |
| Less than $500 | 0 |
| $500 to $999 | 167 |
| $1,000 to $1,499 | 66 |
| $1,500 to $1,999 | 25 |
| $2,000 to $2,499 | 16 |
| $2,500 to $2,999 | 0 |
| $3,000 or more | 0 |
| Median (dollars) | 955 |
| No rent paid | 0 |
Data is based on 2018 Census
ZIP Codes for other locations
State for RUTLAND
Massachusetts ZIP CodesOther cities in Massachusetts