SALISBURY, MA ZIP Code
| City | SALISBURY |
| State | Massachusetts |
| ZIP Codes count | 1 (see all) |
| Post offices count | 2 (see all) |
| Total population | 4,927 (see all) |
ZIP Code in SALISBURY, Massachusetts
01952
This list contains only 5-digit ZIP codes. Use our zip code lookup by address feature to get the full 9-digit (ZIP+4) code.
List of SALISBURY, MA ZIP Codes
| ZIP | TYPE | POPU |
|---|---|---|
| 01952 | STANDARD | 9,152 |
Post offices
NEWBURYPORT — Post Office™ 61 PLEASANT ST NEWBURYPORT, MA 01950-9998 |
SALISBURY — Post Office™ 6 ELM ST UNIT C SALISBURY, MA 01952-9998 |
Envelope example
On the bottom center of the envelope, write the address you want your letter delivered to. Include the following on separate lines:
- Recipient's full name
- Full street address
- City, State, and ZIP Code
Using the same format, write the return address in the top left corner.
Using the full ZIP+4 Code when mailing via the USPS ensures the fastest, most accurate mailing possible. If you are not sure of the full 9-digit ZIP Code, use the 5-digit ZIP Code to avoid loss of letter or package.
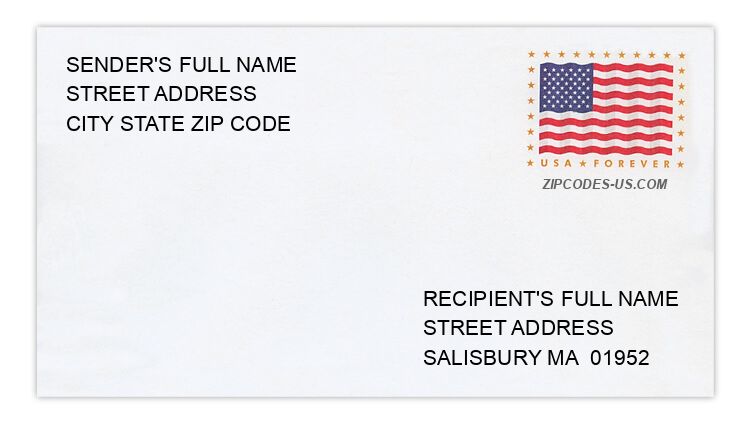
The recipient address information is provided for your reference.
Address example
51 ALLEN DR
SALISBURY MA 01952-1503
SALISBURY MA 01952-1503
84 BROADWAY
SALISBURY MA 01952-2705
SALISBURY MA 01952-2705
65 EMERALD WAY
SALISBURY MA 01952-4008
SALISBURY MA 01952-4008
52 HERON WAY
SALISBURY MA 01952-2515
SALISBURY MA 01952-2515
27 RED RIDGE RD
SALISBURY MA 01952-1448
SALISBURY MA 01952-1448
58 STARFISH WAY
SALISBURY MA 01952-4201
SALISBURY MA 01952-4201
Map
Hover over the map to see the ZIP code
Census data for SALISBURY, MA
Demographic and housing estimates in SALISBURY, MA
| Total population | 4,927 |
| Male | 2,627 |
| Female | 2,300 |
| Total population | 4,927 |
| Under 5 years | 148 |
| 5 to 9 years | 100 |
| 10 to 14 years | 310 |
| 15 to 19 years | 178 |
| 20 to 24 years | 285 |
| 25 to 34 years | 567 |
| 35 to 44 years | 606 |
| 45 to 54 years | 763 |
| 55 to 59 years | 382 |
| 60 to 64 years | 382 |
| 65 to 74 years | 770 |
| 75 to 84 years | 292 |
| 85 years and over | 144 |
| Median age (years) | 47.5 |
| Under 18 years | 686 |
| 16 years and over | 4,311 |
| 18 years and over | 4,241 |
| 21 years and over | 4,175 |
| 62 years and over | 1,450 |
| 65 years and over | 1,206 |
| Total population | 4,927 |
| One race | 4,871 |
| White | 4,853 |
| Black or African American | 0 |
| American Indian and Alaska Native | 0 |
| Asian | 0 |
| Native Hawaiian and Other Pacific Islander | 18 |
| Some other race | 0 |
| Two or more races | 56 |
| Citizen, VOTING AGE 18 and over population | 4,169 |
| Male Citizen, VOTING AGE 18 and over population | 2,168 |
| Female Citizen, VOTING AGE 18 and over population | 2,001 |
Social characteristics in SALISBURY, MA
| Total households | 2,245 |
| Family households (families) | 1,137 |
| Married-couple family | 935 |
| Male householder, no wife present, family | 61 |
| Female householder, no husband present, family | 141 |
| Nonfamily households | 1,108 |
| Average household size | 2.19 |
| Average family size | 3.04 |
Economic characteristics in SALISBURY, MA
| Total households | 2,245 |
| Less than $10,000 | 189 |
| $10,000 to $14,999 | 98 |
| $15,000 to $24,999 | 139 |
| $25,000 to $34,999 | 119 |
| $35,000 to $49,999 | 211 |
| $50,000 to $74,999 | 321 |
| $75,000 to $99,999 | 437 |
| $100,000 to $149,999 | 444 |
| $150,000 to $199,999 | 176 |
| $200,000 or more | 111 |
| Median household income (dollars) | 76,580 |
Housing characteristics in SALISBURY, MA
| Total housing units | 3,392 |
| Occupied housing units | 2,245 |
| Vacant housing units | 1,147 |
| Total housing units | 3,392 |
| 1-unit, detached | 1,460 |
| 1-unit, attached | 327 |
| 2 units | 442 |
| 3 or 4 units | 417 |
| 5 to 9 units | 344 |
| 10 to 19 units | 148 |
| 20 or more units | 138 |
| Mobile home | 116 |
| Boat, RV, van, etc. | 0 |
| Total housing units | 3,392 |
| Built 2014 or later | 137 |
| Built 2010 to 2013 | 61 |
| Built 2000 to 2009 | 580 |
| Built 1990 to 1999 | 343 |
| Built 1980 to 1989 | 341 |
| Built 1970 to 1979 | 437 |
| Built 1960 to 1969 | 324 |
| Built 1950 to 1959 | 251 |
| Built 1940 to 1949 | 158 |
| Built 1939 or earlier | 760 |
| Total housing units | 3,392 |
| 1 room | 36 |
| 2 rooms | 34 |
| 3 rooms | 335 |
| 4 rooms | 853 |
| 5 rooms | 877 |
| 6 rooms | 427 |
| 7 rooms | 454 |
| 8 rooms | 131 |
| 9 rooms or more | 245 |
| Median rooms | 5.0 |
| Total housing units | 3,392 |
| No bedroom | 36 |
| 1 bedroom | 350 |
| 2 bedrooms | 1,305 |
| 3 bedrooms | 1,085 |
| 4 bedrooms | 571 |
| 5 or more bedrooms | 45 |
| Occupied housing units | 2,245 |
| Owner-occupied | 1,593 |
| Renter-occupied | 652 |
| Average household size of owner-occupied unit | 2.35 |
| Average household size of renter-occupied unit | 1.82 |
| Occupied housing units | 2,245 |
| Moved in 2017 or later | 82 |
| Moved in 2015 to 2016 | 303 |
| Moved in 2010 to 2014 | 466 |
| Moved in 2000 to 2009 | 787 |
| Moved in 1990 to 1999 | 237 |
| Moved in 1989 and earlier | 370 |
| Owner-occupied units | 1,593 |
| Less than $50,000 | 28 |
| $50,000 to $99,999 | 11 |
| $100,000 to $149,999 | 75 |
| $150,000 to $199,999 | 100 |
| $200,000 to $299,999 | 300 |
| $300,000 to $499,999 | 786 |
| $500,000 to $999,999 | 221 |
| $1,000,000 or more | 72 |
| Median (dollars) | 356,500 |
| Owner-occupied units | 1,593 |
| Housing units with a mortgage | 1,080 |
| Housing units without a mortgage | 513 |
| Occupied units paying rent | 613 |
| Less than $500 | 68 |
| $500 to $999 | 121 |
| $1,000 to $1,499 | 252 |
| $1,500 to $1,999 | 71 |
| $2,000 to $2,499 | 90 |
| $2,500 to $2,999 | 0 |
| $3,000 or more | 11 |
| Median (dollars) | 1,294 |
| No rent paid | 39 |
Data is based on 2018 Census
ZIP Codes for other locations
State for SALISBURY
Massachusetts ZIP CodesOther cities in Massachusetts