CHEVERLY, MD ZIP Code
| City | CHEVERLY |
| State | Maryland |
| ZIP Codes count | 2 (see all) |
| Post offices count | 3 (see all) |
| Total population | 6,452 (see all) |
ZIP Codes in CHEVERLY, Maryland
20784, 20785
This list contains only 5-digit ZIP codes. Use our zip code lookup by address feature to get the full 9-digit (ZIP+4) code.
List of CHEVERLY, MD ZIP Codes
| ZIP | TYPE | POPU |
|---|---|---|
| 20784 | STANDARD | 32,355 |
| 20785 | STANDARD | 41,655 |
Post offices
LANDOVER — Post Office™ 3312 DODGE PARK RD HYATTSVILLE, MD 20785-9997 |
LANDOVER HILLS — Post Office™ 7400 BUCHANAN ST HYATTSVILLE, MD 20784-2324 |
RIVERDALE — Post Office™ 6411 BALTIMORE AVE RIVERDALE, MD 20737-9998 |
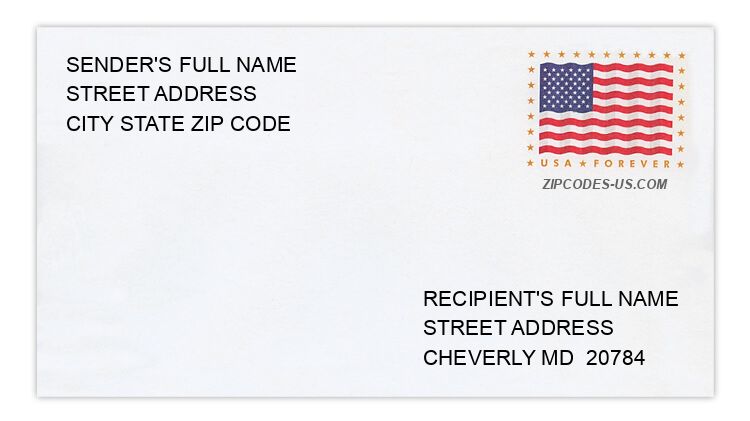
Envelope example
On the bottom center of the envelope, write the address you want your letter delivered to. Include the following on separate lines:
- Recipient's full name
- Full street address
- City, State, and ZIP Code
Using the same format, write the return address in the top left corner.
Using the full ZIP+4 Code when mailing via the USPS ensures the fastest, most accurate mailing possible. If you are not sure of the full 9-digit ZIP Code, use the 5-digit ZIP Code to avoid loss of letter or package.
The recipient address information is provided for your reference.
Address example
2944 56TH PL
CHEVERLY MD 20785-1101
CHEVERLY MD 20785-1101
3084 63RD AVE
CHEVERLY MD 20785-3105
CHEVERLY MD 20785-3105
6269 CHEVERLY PARK DR
CHEVERLY MD 20785-3049
CHEVERLY MD 20785-3049
5778 FOREST RD
CHEVERLY MD 20785-2944
CHEVERLY MD 20785-2944
6362 KILMER ST
CHEVERLY MD 20785-1306
CHEVERLY MD 20785-1306
6195 MONTROSE RD
CHEVERLY MD 20785-1210
CHEVERLY MD 20785-1210
Map
Hover over the map to see the ZIP code
Census data for CHEVERLY, MD
Demographic and housing estimates in CHEVERLY, MD
| Total population | 6,452 |
| Male | 2,936 |
| Female | 3,516 |
| Total population | 6,452 |
| Under 5 years | 569 |
| 5 to 9 years | 387 |
| 10 to 14 years | 323 |
| 15 to 19 years | 215 |
| 20 to 24 years | 285 |
| 25 to 34 years | 980 |
| 35 to 44 years | 900 |
| 45 to 54 years | 869 |
| 55 to 59 years | 506 |
| 60 to 64 years | 360 |
| 65 to 74 years | 801 |
| 75 to 84 years | 201 |
| 85 years and over | 56 |
| Median age (years) | 40.8 |
| Under 18 years | 1,459 |
| 16 years and over | 5,083 |
| 18 years and over | 4,993 |
| 21 years and over | 4,950 |
| 62 years and over | 1,175 |
| 65 years and over | 1,058 |
| Total population | 6,452 |
| One race | 5,973 |
| White | 2,471 |
| Black or African American | 3,119 |
| American Indian and Alaska Native | 0 |
| Asian | 197 |
| Native Hawaiian and Other Pacific Islander | 0 |
| Some other race | 186 |
| Two or more races | 479 |
| Citizen, VOTING AGE 18 and over population | 4,539 |
| Male Citizen, VOTING AGE 18 and over population | 2,029 |
| Female Citizen, VOTING AGE 18 and over population | 2,510 |
Social characteristics in CHEVERLY, MD
| Total households | 2,484 |
| Family households (families) | 1,566 |
| Married-couple family | 1,093 |
| Male householder, no wife present, family | 137 |
| Female householder, no husband present, family | 336 |
| Nonfamily households | 918 |
| Average household size | 2.60 |
| Average family size | 3.33 |
Economic characteristics in CHEVERLY, MD
| Total households | 2,484 |
| Less than $10,000 | 98 |
| $10,000 to $14,999 | 10 |
| $15,000 to $24,999 | 129 |
| $25,000 to $34,999 | 121 |
| $35,000 to $49,999 | 120 |
| $50,000 to $74,999 | 351 |
| $75,000 to $99,999 | 434 |
| $100,000 to $149,999 | 595 |
| $150,000 to $199,999 | 331 |
| $200,000 or more | 295 |
| Median household income (dollars) | 98,056 |
Housing characteristics in CHEVERLY, MD
| Total housing units | 2,619 |
| Occupied housing units | 2,484 |
| Vacant housing units | 135 |
| Total housing units | 2,619 |
| 1-unit, detached | 2,007 |
| 1-unit, attached | 7 |
| 2 units | 0 |
| 3 or 4 units | 14 |
| 5 to 9 units | 158 |
| 10 to 19 units | 413 |
| 20 or more units | 20 |
| Mobile home | 0 |
| Boat, RV, van, etc. | 0 |
| Total housing units | 2,619 |
| Built 2014 or later | 0 |
| Built 2010 to 2013 | 0 |
| Built 2000 to 2009 | 10 |
| Built 1990 to 1999 | 193 |
| Built 1980 to 1989 | 298 |
| Built 1970 to 1979 | 310 |
| Built 1960 to 1969 | 393 |
| Built 1950 to 1959 | 587 |
| Built 1940 to 1949 | 519 |
| Built 1939 or earlier | 309 |
| Total housing units | 2,619 |
| 1 room | 10 |
| 2 rooms | 51 |
| 3 rooms | 152 |
| 4 rooms | 312 |
| 5 rooms | 89 |
| 6 rooms | 569 |
| 7 rooms | 471 |
| 8 rooms | 375 |
| 9 rooms or more | 590 |
| Median rooms | 6.8 |
| Total housing units | 2,619 |
| No bedroom | 10 |
| 1 bedroom | 230 |
| 2 bedrooms | 476 |
| 3 bedrooms | 1,128 |
| 4 bedrooms | 579 |
| 5 or more bedrooms | 196 |
| Occupied housing units | 2,484 |
| Owner-occupied | 1,693 |
| Renter-occupied | 791 |
| Average household size of owner-occupied unit | 2.67 |
| Average household size of renter-occupied unit | 2.43 |
| Occupied housing units | 2,484 |
| Moved in 2017 or later | 69 |
| Moved in 2015 to 2016 | 331 |
| Moved in 2010 to 2014 | 495 |
| Moved in 2000 to 2009 | 718 |
| Moved in 1990 to 1999 | 343 |
| Moved in 1989 and earlier | 528 |
| Owner-occupied units | 1,693 |
| Less than $50,000 | 75 |
| $50,000 to $99,999 | 0 |
| $100,000 to $149,999 | 0 |
| $150,000 to $199,999 | 34 |
| $200,000 to $299,999 | 502 |
| $300,000 to $499,999 | 994 |
| $500,000 to $999,999 | 51 |
| $1,000,000 or more | 37 |
| Median (dollars) | 332,000 |
| Owner-occupied units | 1,693 |
| Housing units with a mortgage | 1,341 |
| Housing units without a mortgage | 352 |
| Occupied units paying rent | 730 |
| Less than $500 | 0 |
| $500 to $999 | 45 |
| $1,000 to $1,499 | 551 |
| $1,500 to $1,999 | 90 |
| $2,000 to $2,499 | 24 |
| $2,500 to $2,999 | 15 |
| $3,000 or more | 5 |
| Median (dollars) | 1,307 |
| No rent paid | 61 |
Data is based on 2018 Census
ZIP Codes for other locations
State for CHEVERLY
Maryland ZIP CodesOther cities in Maryland