LANDOVER, MD ZIP Code
| City | LANDOVER |
| State | Maryland |
| ZIP Codes count | 1 (see all) |
| Post offices count | 2 (see all) |
| Total population | 22,041 (see all) |
ZIP Code in LANDOVER, Maryland
20785
This list contains only 5-digit ZIP codes. Use our zip code lookup by address feature to get the full 9-digit (ZIP+4) code.
List of LANDOVER, MD ZIP Codes
| ZIP | TYPE | POPU |
|---|---|---|
| 20785 | STANDARD | 41,655 |
Post offices
LANDOVER — Post Office™ 3312 DODGE PARK RD HYATTSVILLE, MD 20785-9997 |
LANDOVER HILLS — Post Office™ 7400 BUCHANAN ST HYATTSVILLE, MD 20784-2324 |
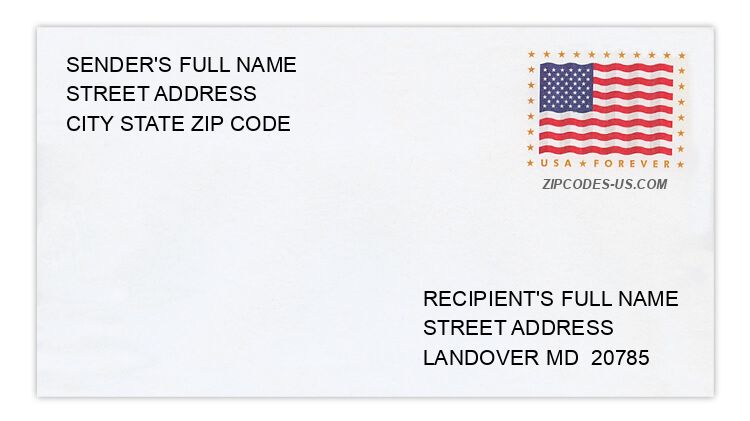
Envelope example
On the bottom center of the envelope, write the address you want your letter delivered to. Include the following on separate lines:
- Recipient's full name
- Full street address
- City, State, and ZIP Code
Using the same format, write the return address in the top left corner.
Using the full ZIP+4 Code when mailing via the USPS ensures the fastest, most accurate mailing possible. If you are not sure of the full 9-digit ZIP Code, use the 5-digit ZIP Code to avoid loss of letter or package.
The recipient address information is provided for your reference.
Address example
9089 CONGRESS PL
LANDOVER MD 20785-4729
LANDOVER MD 20785-4729
9059 CONGRESS PL
LANDOVER MD 20785-4729
LANDOVER MD 20785-4729
9071 CONGRESS PL
LANDOVER MD 20785-4729
LANDOVER MD 20785-4729
8956 CONGRESS PL
LANDOVER MD 20785-4726
LANDOVER MD 20785-4726
9063 CONGRESS PL
LANDOVER MD 20785-4729
LANDOVER MD 20785-4729
8930 CONGRESS PL
LANDOVER MD 20785-4726
LANDOVER MD 20785-4726
Map
Hover over the map to see the ZIP code
Census data for LANDOVER, MD
Demographic and housing estimates in LANDOVER, MD
| Total population | 22,041 |
| Male | 10,299 |
| Female | 11,742 |
| Total population | 22,041 |
| Under 5 years | 1,834 |
| 5 to 9 years | 1,661 |
| 10 to 14 years | 1,231 |
| 15 to 19 years | 1,481 |
| 20 to 24 years | 1,632 |
| 25 to 34 years | 3,581 |
| 35 to 44 years | 2,850 |
| 45 to 54 years | 3,129 |
| 55 to 59 years | 1,302 |
| 60 to 64 years | 1,081 |
| 65 to 74 years | 1,571 |
| 75 to 84 years | 586 |
| 85 years and over | 102 |
| Median age (years) | 33.9 |
| Under 18 years | 5,659 |
| 16 years and over | 16,959 |
| 18 years and over | 16,382 |
| 21 years and over | 15,601 |
| 62 years and over | 2,935 |
| 65 years and over | 2,259 |
| Total population | 22,041 |
| One race | 21,666 |
| White | 2,288 |
| Black or African American | 16,736 |
| American Indian and Alaska Native | 146 |
| Asian | 275 |
| Native Hawaiian and Other Pacific Islander | 19 |
| Some other race | 2,202 |
| Two or more races | 375 |
| Citizen, VOTING AGE 18 and over population | 13,191 |
| Male Citizen, VOTING AGE 18 and over population | 5,475 |
| Female Citizen, VOTING AGE 18 and over population | 7,716 |
Social characteristics in LANDOVER, MD
| Total households | 7,878 |
| Family households (families) | 5,169 |
| Married-couple family | 2,238 |
| Male householder, no wife present, family | 604 |
| Female householder, no husband present, family | 2,327 |
| Nonfamily households | 2,709 |
| Average household size | 2.79 |
| Average family size | 3.45 |
Economic characteristics in LANDOVER, MD
| Total households | 7,878 |
| Less than $10,000 | 417 |
| $10,000 to $14,999 | 292 |
| $15,000 to $24,999 | 661 |
| $25,000 to $34,999 | 909 |
| $35,000 to $49,999 | 1,085 |
| $50,000 to $74,999 | 1,839 |
| $75,000 to $99,999 | 968 |
| $100,000 to $149,999 | 1,127 |
| $150,000 to $199,999 | 398 |
| $200,000 or more | 182 |
| Median household income (dollars) | 56,364 |
Housing characteristics in LANDOVER, MD
| Total housing units | 8,484 |
| Occupied housing units | 7,878 |
| Vacant housing units | 606 |
| Total housing units | 8,484 |
| 1-unit, detached | 2,225 |
| 1-unit, attached | 3,000 |
| 2 units | 106 |
| 3 or 4 units | 147 |
| 5 to 9 units | 1,065 |
| 10 to 19 units | 1,690 |
| 20 or more units | 245 |
| Mobile home | 6 |
| Boat, RV, van, etc. | 0 |
| Total housing units | 8,484 |
| Built 2014 or later | 12 |
| Built 2010 to 2013 | 57 |
| Built 2000 to 2009 | 795 |
| Built 1990 to 1999 | 596 |
| Built 1980 to 1989 | 958 |
| Built 1970 to 1979 | 1,382 |
| Built 1960 to 1969 | 1,574 |
| Built 1950 to 1959 | 2,100 |
| Built 1940 to 1949 | 526 |
| Built 1939 or earlier | 484 |
| Total housing units | 8,484 |
| 1 room | 68 |
| 2 rooms | 184 |
| 3 rooms | 741 |
| 4 rooms | 2,093 |
| 5 rooms | 2,093 |
| 6 rooms | 1,698 |
| 7 rooms | 731 |
| 8 rooms | 498 |
| 9 rooms or more | 378 |
| Median rooms | 5.1 |
| Total housing units | 8,484 |
| No bedroom | 68 |
| 1 bedroom | 879 |
| 2 bedrooms | 2,903 |
| 3 bedrooms | 3,761 |
| 4 bedrooms | 598 |
| 5 or more bedrooms | 275 |
| Occupied housing units | 7,878 |
| Owner-occupied | 3,633 |
| Renter-occupied | 4,245 |
| Average household size of owner-occupied unit | 2.82 |
| Average household size of renter-occupied unit | 2.76 |
| Occupied housing units | 7,878 |
| Moved in 2017 or later | 431 |
| Moved in 2015 to 2016 | 870 |
| Moved in 2010 to 2014 | 2,854 |
| Moved in 2000 to 2009 | 1,852 |
| Moved in 1990 to 1999 | 887 |
| Moved in 1989 and earlier | 984 |
| Owner-occupied units | 3,633 |
| Less than $50,000 | 82 |
| $50,000 to $99,999 | 308 |
| $100,000 to $149,999 | 670 |
| $150,000 to $199,999 | 950 |
| $200,000 to $299,999 | 1,214 |
| $300,000 to $499,999 | 379 |
| $500,000 to $999,999 | 10 |
| $1,000,000 or more | 20 |
| Median (dollars) | 189,100 |
| Owner-occupied units | 3,633 |
| Housing units with a mortgage | 3,108 |
| Housing units without a mortgage | 525 |
| Occupied units paying rent | 4,185 |
| Less than $500 | 211 |
| $500 to $999 | 238 |
| $1,000 to $1,499 | 2,395 |
| $1,500 to $1,999 | 1,158 |
| $2,000 to $2,499 | 158 |
| $2,500 to $2,999 | 17 |
| $3,000 or more | 8 |
| Median (dollars) | 1,349 |
| No rent paid | 60 |
Data is based on 2018 Census
ZIP Codes for other locations
State for LANDOVER
Maryland ZIP CodesOther cities in Maryland