OLNEY, MD ZIP Code
| City | OLNEY |
| State | Maryland |
| ZIP Codes count | 2 (see all) |
| Post offices count | 1 (see all) |
| Total population | 35,280 (see all) |
ZIP Codes in OLNEY, Maryland
20830, 20832
This list contains only 5-digit ZIP codes. Use our zip code lookup by address feature to get the full 9-digit (ZIP+4) code.
List of OLNEY, MD ZIP Codes
| ZIP | TYPE | POPU |
|---|---|---|
| 20830 | PO BOX | – |
| 20832 | STANDARD | 25,852 |
Post offices
OLNEY — Post Office™ 3570 OLNEY LAYTONSVILLE RD OLNEY, MD 20832-9998 |
Envelope example
On the bottom center of the envelope, write the address you want your letter delivered to. Include the following on separate lines:
- Recipient's full name
- Full street address
- City, State, and ZIP Code
Using the same format, write the return address in the top left corner.
Using the full ZIP+4 Code when mailing via the USPS ensures the fastest, most accurate mailing possible. If you are not sure of the full 9-digit ZIP Code, use the 5-digit ZIP Code to avoid loss of letter or package.
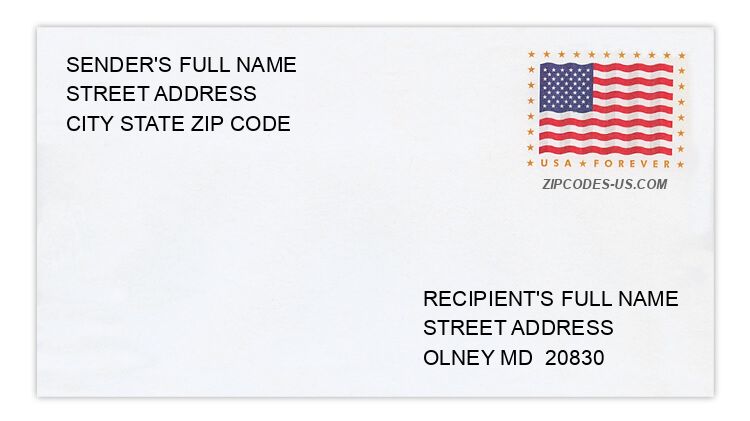
The recipient address information is provided for your reference.
Address example
3136 BENTON SQUARE DR
OLNEY MD 20832-2539
OLNEY MD 20832-2539
3382 BUEHLER CT
OLNEY MD 20832-2306
OLNEY MD 20832-2306
18679 CLOVER HILL LN
OLNEY MD 20832-1202
OLNEY MD 20832-1202
2040 PETERSFIELD PL
OLNEY MD 20832-1664
OLNEY MD 20832-1664
18056 ROLLING MEADOW WAY
OLNEY MD 20832-1784
OLNEY MD 20832-1784
18096 WAGONWHEEL CT
OLNEY MD 20832-2800
OLNEY MD 20832-2800
Map
Hover over the map to see the ZIP code
Census data for OLNEY, MD
Demographic and housing estimates in OLNEY, MD
| Total population | 35,280 |
| Male | 17,112 |
| Female | 18,168 |
| Total population | 35,280 |
| Under 5 years | 1,958 |
| 5 to 9 years | 2,087 |
| 10 to 14 years | 2,462 |
| 15 to 19 years | 2,321 |
| 20 to 24 years | 2,341 |
| 25 to 34 years | 3,262 |
| 35 to 44 years | 4,440 |
| 45 to 54 years | 5,153 |
| 55 to 59 years | 3,289 |
| 60 to 64 years | 2,480 |
| 65 to 74 years | 3,419 |
| 75 to 84 years | 1,387 |
| 85 years and over | 681 |
| Median age (years) | 42.1 |
| Under 18 years | 7,965 |
| 16 years and over | 28,175 |
| 18 years and over | 27,315 |
| 21 years and over | 26,102 |
| 62 years and over | 7,024 |
| 65 years and over | 5,487 |
| Total population | 35,280 |
| One race | 33,781 |
| White | 24,749 |
| Black or African American | 3,567 |
| American Indian and Alaska Native | 133 |
| Asian | 4,216 |
| Native Hawaiian and Other Pacific Islander | 10 |
| Some other race | 1,106 |
| Two or more races | 1,499 |
| Citizen, VOTING AGE 18 and over population | 25,156 |
| Male Citizen, VOTING AGE 18 and over population | 12,127 |
| Female Citizen, VOTING AGE 18 and over population | 13,029 |
Social characteristics in OLNEY, MD
| Total households | 11,655 |
| Family households (families) | 9,697 |
| Married-couple family | 8,267 |
| Male householder, no wife present, family | 319 |
| Female householder, no husband present, family | 1,111 |
| Nonfamily households | 1,958 |
| Average household size | 3.01 |
| Average family size | 3.35 |
Economic characteristics in OLNEY, MD
| Total households | 11,655 |
| Less than $10,000 | 274 |
| $10,000 to $14,999 | 146 |
| $15,000 to $24,999 | 230 |
| $25,000 to $34,999 | 334 |
| $35,000 to $49,999 | 419 |
| $50,000 to $74,999 | 1,291 |
| $75,000 to $99,999 | 1,136 |
| $100,000 to $149,999 | 2,508 |
| $150,000 to $199,999 | 1,865 |
| $200,000 or more | 3,452 |
| Median household income (dollars) | 139,524 |
Housing characteristics in OLNEY, MD
| Total housing units | 11,896 |
| Occupied housing units | 11,655 |
| Vacant housing units | 241 |
| Total housing units | 11,896 |
| 1-unit, detached | 7,852 |
| 1-unit, attached | 3,154 |
| 2 units | 20 |
| 3 or 4 units | 54 |
| 5 to 9 units | 390 |
| 10 to 19 units | 194 |
| 20 or more units | 232 |
| Mobile home | 0 |
| Boat, RV, van, etc. | 0 |
| Total housing units | 11,896 |
| Built 2014 or later | 171 |
| Built 2010 to 2013 | 224 |
| Built 2000 to 2009 | 869 |
| Built 1990 to 1999 | 2,545 |
| Built 1980 to 1989 | 3,959 |
| Built 1970 to 1979 | 2,860 |
| Built 1960 to 1969 | 721 |
| Built 1950 to 1959 | 298 |
| Built 1940 to 1949 | 110 |
| Built 1939 or earlier | 139 |
| Total housing units | 11,896 |
| 1 room | 44 |
| 2 rooms | 95 |
| 3 rooms | 304 |
| 4 rooms | 544 |
| 5 rooms | 901 |
| 6 rooms | 1,404 |
| 7 rooms | 1,791 |
| 8 rooms | 1,626 |
| 9 rooms or more | 5,187 |
| Median rooms | 8.0 |
| Total housing units | 11,896 |
| No bedroom | 44 |
| 1 bedroom | 274 |
| 2 bedrooms | 905 |
| 3 bedrooms | 4,261 |
| 4 bedrooms | 4,460 |
| 5 or more bedrooms | 1,952 |
| Occupied housing units | 11,655 |
| Owner-occupied | 10,552 |
| Renter-occupied | 1,103 |
| Average household size of owner-occupied unit | 3.06 |
| Average household size of renter-occupied unit | 2.58 |
| Occupied housing units | 11,655 |
| Moved in 2017 or later | 272 |
| Moved in 2015 to 2016 | 827 |
| Moved in 2010 to 2014 | 2,365 |
| Moved in 2000 to 2009 | 3,484 |
| Moved in 1990 to 1999 | 2,541 |
| Moved in 1989 and earlier | 2,166 |
| Owner-occupied units | 10,552 |
| Less than $50,000 | 177 |
| $50,000 to $99,999 | 58 |
| $100,000 to $149,999 | 181 |
| $150,000 to $199,999 | 216 |
| $200,000 to $299,999 | 777 |
| $300,000 to $499,999 | 3,921 |
| $500,000 to $999,999 | 5,072 |
| $1,000,000 or more | 150 |
| Median (dollars) | 497,600 |
| Owner-occupied units | 10,552 |
| Housing units with a mortgage | 8,422 |
| Housing units without a mortgage | 2,130 |
| Occupied units paying rent | 1,033 |
| Less than $500 | 151 |
| $500 to $999 | 123 |
| $1,000 to $1,499 | 128 |
| $1,500 to $1,999 | 187 |
| $2,000 to $2,499 | 315 |
| $2,500 to $2,999 | 91 |
| $3,000 or more | 38 |
| Median (dollars) | 1,806 |
| No rent paid | 70 |
Data is based on 2018 Census
ZIP Codes for other locations
State for OLNEY
Maryland ZIP CodesOther cities in Maryland