BRONSON, MI ZIP Code
| City | BRONSON |
| State | Michigan |
| ZIP Codes count | 1 (see all) |
| Post offices count | 1 (see all) |
| Total population | 2,378 (see all) |
ZIP Code in BRONSON, Michigan
49028
This list contains only 5-digit ZIP codes. Use our zip code lookup by address feature to get the full 9-digit (ZIP+4) code.
List of BRONSON, MI ZIP Codes
| ZIP | TYPE | POPU |
|---|---|---|
| 49028 | STANDARD | 5,712 |
Post offices
BRONSON — Post Office™ 220 E CHICAGO ST BRONSON, MI 49028-9998 |
Envelope example
On the bottom center of the envelope, write the address you want your letter delivered to. Include the following on separate lines:
- Recipient's full name
- Full street address
- City, State, and ZIP Code
Using the same format, write the return address in the top left corner.
Using the full ZIP+4 Code when mailing via the USPS ensures the fastest, most accurate mailing possible. If you are not sure of the full 9-digit ZIP Code, use the 5-digit ZIP Code to avoid loss of letter or package.
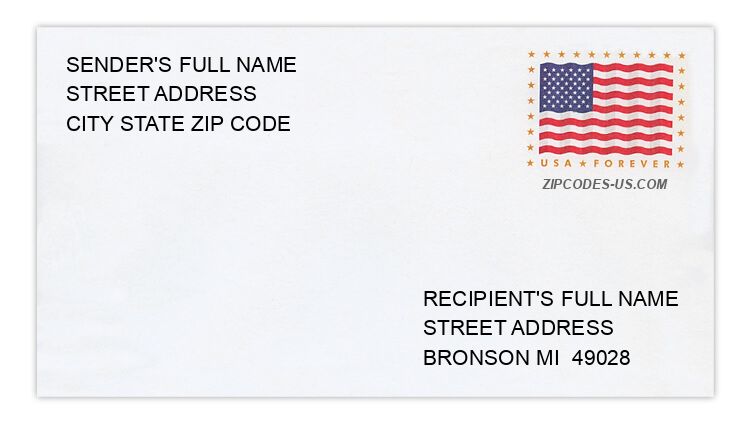
The recipient address information is provided for your reference.
Address example
369 ARBORGAST RD
BRONSON MI 49028-9369
BRONSON MI 49028-9369
753 KOLASSA RD
BRONSON MI 49028-9304
BRONSON MI 49028-9304
1265 SMOKER RD
BRONSON MI 49028-9411
BRONSON MI 49028-9411
481 SNOW PRAIRIE RD
BRONSON MI 49028-9263
BRONSON MI 49028-9263
597 SOUTHERN RD
BRONSON MI 49028-9234
BRONSON MI 49028-9234
1183 TRAYER RD
BRONSON MI 49028-9768
BRONSON MI 49028-9768
Map
Hover over the map to see the ZIP code
Census data for BRONSON, MI
Demographic and housing estimates in BRONSON, MI
| Total population | 2,378 |
| Male | 1,112 |
| Female | 1,266 |
| Total population | 2,378 |
| Under 5 years | 158 |
| 5 to 9 years | 82 |
| 10 to 14 years | 167 |
| 15 to 19 years | 322 |
| 20 to 24 years | 140 |
| 25 to 34 years | 341 |
| 35 to 44 years | 266 |
| 45 to 54 years | 306 |
| 55 to 59 years | 210 |
| 60 to 64 years | 106 |
| 65 to 74 years | 184 |
| 75 to 84 years | 45 |
| 85 years and over | 51 |
| Median age (years) | 34.4 |
| Under 18 years | 563 |
| 16 years and over | 1,926 |
| 18 years and over | 1,815 |
| 21 years and over | 1,631 |
| 62 years and over | 339 |
| 65 years and over | 280 |
| Total population | 2,378 |
| One race | 2,296 |
| White | 1,977 |
| Black or African American | 40 |
| American Indian and Alaska Native | 0 |
| Asian | 0 |
| Native Hawaiian and Other Pacific Islander | 0 |
| Some other race | 279 |
| Two or more races | 82 |
| Citizen, VOTING AGE 18 and over population | 1,684 |
| Male Citizen, VOTING AGE 18 and over population | 791 |
| Female Citizen, VOTING AGE 18 and over population | 893 |
Social characteristics in BRONSON, MI
| Total households | 887 |
| Family households (families) | 559 |
| Married-couple family | 325 |
| Male householder, no wife present, family | 40 |
| Female householder, no husband present, family | 194 |
| Nonfamily households | 328 |
| Average household size | 2.63 |
| Average family size | 3.26 |
Economic characteristics in BRONSON, MI
| Total households | 887 |
| Less than $10,000 | 64 |
| $10,000 to $14,999 | 94 |
| $15,000 to $24,999 | 169 |
| $25,000 to $34,999 | 58 |
| $35,000 to $49,999 | 116 |
| $50,000 to $74,999 | 145 |
| $75,000 to $99,999 | 146 |
| $100,000 to $149,999 | 74 |
| $150,000 to $199,999 | 13 |
| $200,000 or more | 8 |
| Median household income (dollars) | 41,679 |
Housing characteristics in BRONSON, MI
| Total housing units | 976 |
| Occupied housing units | 887 |
| Vacant housing units | 89 |
| Total housing units | 976 |
| 1-unit, detached | 717 |
| 1-unit, attached | 6 |
| 2 units | 5 |
| 3 or 4 units | 57 |
| 5 to 9 units | 88 |
| 10 to 19 units | 38 |
| 20 or more units | 29 |
| Mobile home | 36 |
| Boat, RV, van, etc. | 0 |
| Total housing units | 976 |
| Built 2014 or later | 0 |
| Built 2010 to 2013 | 0 |
| Built 2000 to 2009 | 11 |
| Built 1990 to 1999 | 87 |
| Built 1980 to 1989 | 43 |
| Built 1970 to 1979 | 125 |
| Built 1960 to 1969 | 93 |
| Built 1950 to 1959 | 171 |
| Built 1940 to 1949 | 127 |
| Built 1939 or earlier | 319 |
| Total housing units | 976 |
| 1 room | 16 |
| 2 rooms | 11 |
| 3 rooms | 67 |
| 4 rooms | 144 |
| 5 rooms | 180 |
| 6 rooms | 224 |
| 7 rooms | 111 |
| 8 rooms | 124 |
| 9 rooms or more | 99 |
| Median rooms | 5.8 |
| Total housing units | 976 |
| No bedroom | 16 |
| 1 bedroom | 107 |
| 2 bedrooms | 292 |
| 3 bedrooms | 416 |
| 4 bedrooms | 131 |
| 5 or more bedrooms | 14 |
| Occupied housing units | 887 |
| Owner-occupied | 560 |
| Renter-occupied | 327 |
| Average household size of owner-occupied unit | 2.76 |
| Average household size of renter-occupied unit | 2.41 |
| Occupied housing units | 887 |
| Moved in 2017 or later | 88 |
| Moved in 2015 to 2016 | 115 |
| Moved in 2010 to 2014 | 189 |
| Moved in 2000 to 2009 | 187 |
| Moved in 1990 to 1999 | 160 |
| Moved in 1989 and earlier | 148 |
| Owner-occupied units | 560 |
| Less than $50,000 | 116 |
| $50,000 to $99,999 | 277 |
| $100,000 to $149,999 | 124 |
| $150,000 to $199,999 | 18 |
| $200,000 to $299,999 | 14 |
| $300,000 to $499,999 | 0 |
| $500,000 to $999,999 | 11 |
| $1,000,000 or more | 0 |
| Median (dollars) | 78,800 |
| Owner-occupied units | 560 |
| Housing units with a mortgage | 388 |
| Housing units without a mortgage | 172 |
| Occupied units paying rent | 297 |
| Less than $500 | 85 |
| $500 to $999 | 187 |
| $1,000 to $1,499 | 25 |
| $1,500 to $1,999 | 0 |
| $2,000 to $2,499 | 0 |
| $2,500 to $2,999 | 0 |
| $3,000 or more | 0 |
| Median (dollars) | 659 |
| No rent paid | 30 |
Data is based on 2018 Census
ZIP Codes for other locations
State for BRONSON
Michigan ZIP CodesOther cities in Michigan