CHESANING, MI ZIP Code
| City | CHESANING |
| State | Michigan |
| ZIP Codes count | 1 (see all) |
| Post offices count | 1 (see all) |
| Total population | 2,390 (see all) |
ZIP Code in CHESANING, Michigan
48616
This list contains only 5-digit ZIP codes. Use our zip code lookup by address feature to get the full 9-digit (ZIP+4) code.
List of CHESANING, MI ZIP Codes
| ZIP | TYPE | POPU |
|---|---|---|
| 48616 | STANDARD | 7,560 |
Post offices
CHESANING — Post Office™ 230 E BROAD ST CHESANING, MI 48616-1559 |
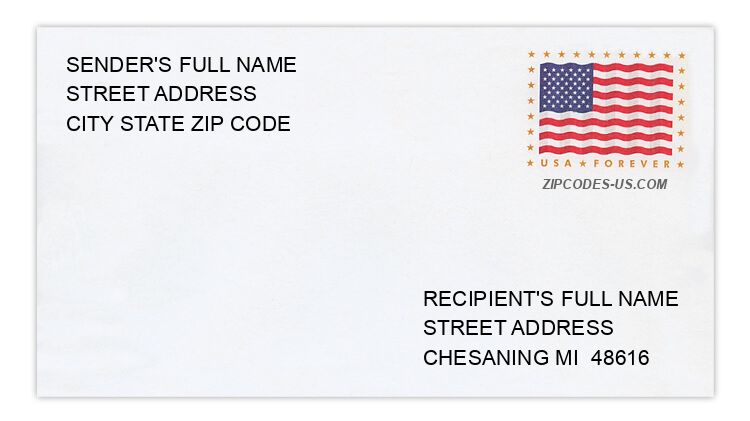
Envelope example
On the bottom center of the envelope, write the address you want your letter delivered to. Include the following on separate lines:
- Recipient's full name
- Full street address
- City, State, and ZIP Code
Using the same format, write the return address in the top left corner.
Using the full ZIP+4 Code when mailing via the USPS ensures the fastest, most accurate mailing possible. If you are not sure of the full 9-digit ZIP Code, use the 5-digit ZIP Code to avoid loss of letter or package.
The recipient address information is provided for your reference.
Address example
10144 DITCH RD
CHESANING MI 48616-9706
CHESANING MI 48616-9706
739 GASPER ST
CHESANING MI 48616-1722
CHESANING MI 48616-1722
13951 LARNER RD
CHESANING MI 48616-9445
CHESANING MI 48616-9445
1289 N CORUNNA RD
CHESANING MI 48616-9490
CHESANING MI 48616-9490
195 PEARL ST
CHESANING MI 48616-12ND
CHESANING MI 48616-12ND
516 S LINE ST
CHESANING MI 48616-1339
CHESANING MI 48616-1339
Map
Hover over the map to see the ZIP code
Census data for CHESANING, MI
Demographic and housing estimates in CHESANING, MI
| Total population | 2,390 |
| Male | 1,224 |
| Female | 1,166 |
| Total population | 2,390 |
| Under 5 years | 197 |
| 5 to 9 years | 192 |
| 10 to 14 years | 128 |
| 15 to 19 years | 168 |
| 20 to 24 years | 136 |
| 25 to 34 years | 273 |
| 35 to 44 years | 318 |
| 45 to 54 years | 304 |
| 55 to 59 years | 117 |
| 60 to 64 years | 112 |
| 65 to 74 years | 288 |
| 75 to 84 years | 128 |
| 85 years and over | 29 |
| Median age (years) | 36.8 |
| Under 18 years | 659 |
| 16 years and over | 1,812 |
| 18 years and over | 1,731 |
| 21 years and over | 1,671 |
| 62 years and over | 496 |
| 65 years and over | 445 |
| Total population | 2,390 |
| One race | 2,362 |
| White | 2,259 |
| Black or African American | 10 |
| American Indian and Alaska Native | 0 |
| Asian | 0 |
| Native Hawaiian and Other Pacific Islander | 0 |
| Some other race | 93 |
| Two or more races | 28 |
| Citizen, VOTING AGE 18 and over population | 1,699 |
| Male Citizen, VOTING AGE 18 and over population | 805 |
| Female Citizen, VOTING AGE 18 and over population | 894 |
Social characteristics in CHESANING, MI
| Total households | 997 |
| Family households (families) | 640 |
| Married-couple family | 405 |
| Male householder, no wife present, family | 93 |
| Female householder, no husband present, family | 142 |
| Nonfamily households | 357 |
| Average household size | 2.34 |
| Average family size | 2.92 |
Economic characteristics in CHESANING, MI
| Total households | 997 |
| Less than $10,000 | 77 |
| $10,000 to $14,999 | 80 |
| $15,000 to $24,999 | 81 |
| $25,000 to $34,999 | 154 |
| $35,000 to $49,999 | 172 |
| $50,000 to $74,999 | 214 |
| $75,000 to $99,999 | 136 |
| $100,000 to $149,999 | 47 |
| $150,000 to $199,999 | 10 |
| $200,000 or more | 26 |
| Median household income (dollars) | 43,447 |
Housing characteristics in CHESANING, MI
| Total housing units | 1,132 |
| Occupied housing units | 997 |
| Vacant housing units | 135 |
| Total housing units | 1,132 |
| 1-unit, detached | 778 |
| 1-unit, attached | 44 |
| 2 units | 103 |
| 3 or 4 units | 50 |
| 5 to 9 units | 101 |
| 10 to 19 units | 5 |
| 20 or more units | 44 |
| Mobile home | 7 |
| Boat, RV, van, etc. | 0 |
| Total housing units | 1,132 |
| Built 2014 or later | 4 |
| Built 2010 to 2013 | 0 |
| Built 2000 to 2009 | 4 |
| Built 1990 to 1999 | 84 |
| Built 1980 to 1989 | 103 |
| Built 1970 to 1979 | 180 |
| Built 1960 to 1969 | 124 |
| Built 1950 to 1959 | 185 |
| Built 1940 to 1949 | 80 |
| Built 1939 or earlier | 368 |
| Total housing units | 1,132 |
| 1 room | 0 |
| 2 rooms | 25 |
| 3 rooms | 79 |
| 4 rooms | 207 |
| 5 rooms | 257 |
| 6 rooms | 278 |
| 7 rooms | 90 |
| 8 rooms | 127 |
| 9 rooms or more | 69 |
| Median rooms | 5.5 |
| Total housing units | 1,132 |
| No bedroom | 0 |
| 1 bedroom | 144 |
| 2 bedrooms | 384 |
| 3 bedrooms | 462 |
| 4 bedrooms | 92 |
| 5 or more bedrooms | 50 |
| Occupied housing units | 997 |
| Owner-occupied | 624 |
| Renter-occupied | 373 |
| Average household size of owner-occupied unit | 2.36 |
| Average household size of renter-occupied unit | 2.30 |
| Occupied housing units | 997 |
| Moved in 2017 or later | 45 |
| Moved in 2015 to 2016 | 130 |
| Moved in 2010 to 2014 | 299 |
| Moved in 2000 to 2009 | 245 |
| Moved in 1990 to 1999 | 109 |
| Moved in 1989 and earlier | 169 |
| Owner-occupied units | 624 |
| Less than $50,000 | 78 |
| $50,000 to $99,999 | 349 |
| $100,000 to $149,999 | 144 |
| $150,000 to $199,999 | 28 |
| $200,000 to $299,999 | 20 |
| $300,000 to $499,999 | 5 |
| $500,000 to $999,999 | 0 |
| $1,000,000 or more | 0 |
| Median (dollars) | 85,300 |
| Owner-occupied units | 624 |
| Housing units with a mortgage | 401 |
| Housing units without a mortgage | 223 |
| Occupied units paying rent | 349 |
| Less than $500 | 91 |
| $500 to $999 | 228 |
| $1,000 to $1,499 | 30 |
| $1,500 to $1,999 | 0 |
| $2,000 to $2,499 | 0 |
| $2,500 to $2,999 | 0 |
| $3,000 or more | 0 |
| Median (dollars) | 628 |
| No rent paid | 24 |
Data is based on 2018 Census
ZIP Codes for other locations
State for CHESANING
Michigan ZIP CodesOther cities in Michigan