CLARE, MI ZIP Code
| City | CLARE |
| State | Michigan |
| ZIP Codes count | 1 (see all) |
| Post offices count | 1 (see all) |
| Total population | 3,045 (see all) |
ZIP Code in CLARE, Michigan
48617
This list contains only 5-digit ZIP codes. Use our zip code lookup by address feature to get the full 9-digit (ZIP+4) code.
List of CLARE, MI ZIP Codes
| ZIP | TYPE | POPU |
|---|---|---|
| 48617 | STANDARD | 9,573 |
Post offices
CLARE — Post Office™ 111 W 5TH ST CLARE, MI 48617-1497 |
Envelope example
On the bottom center of the envelope, write the address you want your letter delivered to. Include the following on separate lines:
- Recipient's full name
- Full street address
- City, State, and ZIP Code
Using the same format, write the return address in the top left corner.
Using the full ZIP+4 Code when mailing via the USPS ensures the fastest, most accurate mailing possible. If you are not sure of the full 9-digit ZIP Code, use the 5-digit ZIP Code to avoid loss of letter or package.
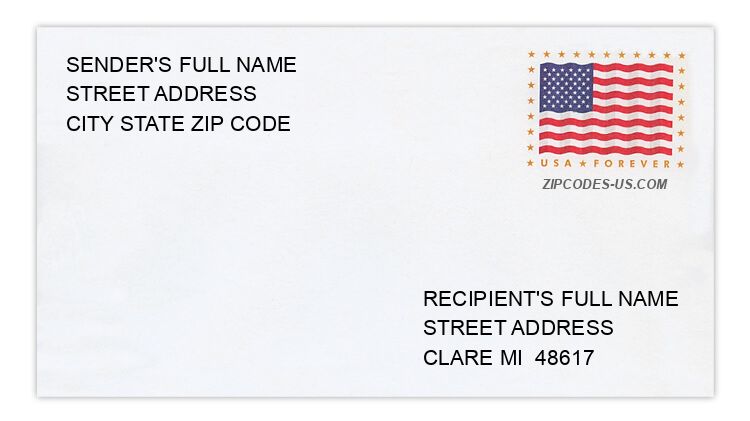
The recipient address information is provided for your reference.
Address example
272 E 5TH ST
CLARE MI 48617-1514
CLARE MI 48617-1514
6329 E ASHARD RD
CLARE MI 48617-9763
CLARE MI 48617-9763
7992 E US 10
CLARE MI 48617-8542
CLARE MI 48617-8542
1302 PARK ST
CLARE MI 48617-9729
CLARE MI 48617-9729
1941 PARKVIEW DR
CLARE MI 48617-9148
CLARE MI 48617-9148
623 VANGEE ST
CLARE MI 48617-9410
CLARE MI 48617-9410
Map
Hover over the map to see the ZIP code
Census data for CLARE, MI
Demographic and housing estimates in CLARE, MI
| Total population | 3,045 |
| Male | 1,266 |
| Female | 1,779 |
| Total population | 3,045 |
| Under 5 years | 187 |
| 5 to 9 years | 274 |
| 10 to 14 years | 83 |
| 15 to 19 years | 159 |
| 20 to 24 years | 176 |
| 25 to 34 years | 396 |
| 35 to 44 years | 416 |
| 45 to 54 years | 461 |
| 55 to 59 years | 125 |
| 60 to 64 years | 181 |
| 65 to 74 years | 288 |
| 75 to 84 years | 200 |
| 85 years and over | 99 |
| Median age (years) | 40.3 |
| Under 18 years | 617 |
| 16 years and over | 2,468 |
| 18 years and over | 2,428 |
| 21 years and over | 2,277 |
| 62 years and over | 706 |
| 65 years and over | 587 |
| Total population | 3,045 |
| One race | 2,996 |
| White | 2,950 |
| Black or African American | 27 |
| American Indian and Alaska Native | 12 |
| Asian | 0 |
| Native Hawaiian and Other Pacific Islander | 0 |
| Some other race | 7 |
| Two or more races | 49 |
| Citizen, VOTING AGE 18 and over population | 2,403 |
| Male Citizen, VOTING AGE 18 and over population | 1,080 |
| Female Citizen, VOTING AGE 18 and over population | 1,323 |
Social characteristics in CLARE, MI
| Total households | 1,319 |
| Family households (families) | 706 |
| Married-couple family | 583 |
| Male householder, no wife present, family | 37 |
| Female householder, no husband present, family | 86 |
| Nonfamily households | 613 |
| Average household size | 2.23 |
| Average family size | 3.05 |
Economic characteristics in CLARE, MI
| Total households | 1,319 |
| Less than $10,000 | 170 |
| $10,000 to $14,999 | 80 |
| $15,000 to $24,999 | 194 |
| $25,000 to $34,999 | 142 |
| $35,000 to $49,999 | 172 |
| $50,000 to $74,999 | 97 |
| $75,000 to $99,999 | 213 |
| $100,000 to $149,999 | 208 |
| $150,000 to $199,999 | 36 |
| $200,000 or more | 7 |
| Median household income (dollars) | 43,184 |
Housing characteristics in CLARE, MI
| Total housing units | 1,582 |
| Occupied housing units | 1,319 |
| Vacant housing units | 263 |
| Total housing units | 1,582 |
| 1-unit, detached | 969 |
| 1-unit, attached | 9 |
| 2 units | 19 |
| 3 or 4 units | 78 |
| 5 to 9 units | 143 |
| 10 to 19 units | 99 |
| 20 or more units | 178 |
| Mobile home | 87 |
| Boat, RV, van, etc. | 0 |
| Total housing units | 1,582 |
| Built 2014 or later | 0 |
| Built 2010 to 2013 | 82 |
| Built 2000 to 2009 | 161 |
| Built 1990 to 1999 | 161 |
| Built 1980 to 1989 | 71 |
| Built 1970 to 1979 | 371 |
| Built 1960 to 1969 | 149 |
| Built 1950 to 1959 | 216 |
| Built 1940 to 1949 | 20 |
| Built 1939 or earlier | 351 |
| Total housing units | 1,582 |
| 1 room | 23 |
| 2 rooms | 9 |
| 3 rooms | 224 |
| 4 rooms | 298 |
| 5 rooms | 284 |
| 6 rooms | 248 |
| 7 rooms | 228 |
| 8 rooms | 106 |
| 9 rooms or more | 162 |
| Median rooms | 5.3 |
| Total housing units | 1,582 |
| No bedroom | 23 |
| 1 bedroom | 143 |
| 2 bedrooms | 622 |
| 3 bedrooms | 579 |
| 4 bedrooms | 133 |
| 5 or more bedrooms | 82 |
| Occupied housing units | 1,319 |
| Owner-occupied | 769 |
| Renter-occupied | 550 |
| Average household size of owner-occupied unit | 2.55 |
| Average household size of renter-occupied unit | 1.79 |
| Occupied housing units | 1,319 |
| Moved in 2017 or later | 90 |
| Moved in 2015 to 2016 | 139 |
| Moved in 2010 to 2014 | 447 |
| Moved in 2000 to 2009 | 229 |
| Moved in 1990 to 1999 | 261 |
| Moved in 1989 and earlier | 153 |
| Owner-occupied units | 769 |
| Less than $50,000 | 46 |
| $50,000 to $99,999 | 286 |
| $100,000 to $149,999 | 275 |
| $150,000 to $199,999 | 75 |
| $200,000 to $299,999 | 76 |
| $300,000 to $499,999 | 11 |
| $500,000 to $999,999 | 0 |
| $1,000,000 or more | 0 |
| Median (dollars) | 108,100 |
| Owner-occupied units | 769 |
| Housing units with a mortgage | 471 |
| Housing units without a mortgage | 298 |
| Occupied units paying rent | 514 |
| Less than $500 | 151 |
| $500 to $999 | 313 |
| $1,000 to $1,499 | 50 |
| $1,500 to $1,999 | 0 |
| $2,000 to $2,499 | 0 |
| $2,500 to $2,999 | 0 |
| $3,000 or more | 0 |
| Median (dollars) | 642 |
| No rent paid | 36 |
Data is based on 2018 Census
ZIP Codes for other locations
State for CLARE
Michigan ZIP CodesOther cities in Michigan