MORRICE, MI ZIP Code
| City | MORRICE |
| State | Michigan |
| ZIP Codes count | 1 (see all) |
| Post offices count | 2 (see all) |
| Total population | 1,210 (see all) |
ZIP Code in MORRICE, Michigan
48857
This list contains only 5-digit ZIP codes. Use our zip code lookup by address feature to get the full 9-digit (ZIP+4) code.
List of MORRICE, MI ZIP Codes
| ZIP | TYPE | POPU |
|---|---|---|
| 48857 | STANDARD | 3,482 |
Post offices
MORRICE — Post Office™ 316 MAIN ST MORRICE, MI 48857-2523 |
PERRY — Post Office™ 200 N MAIN PERRY, MI 48872-9700 |
Envelope example
On the bottom center of the envelope, write the address you want your letter delivered to. Include the following on separate lines:
- Recipient's full name
- Full street address
- City, State, and ZIP Code
Using the same format, write the return address in the top left corner.
Using the full ZIP+4 Code when mailing via the USPS ensures the fastest, most accurate mailing possible. If you are not sure of the full 9-digit ZIP Code, use the 5-digit ZIP Code to avoid loss of letter or package.
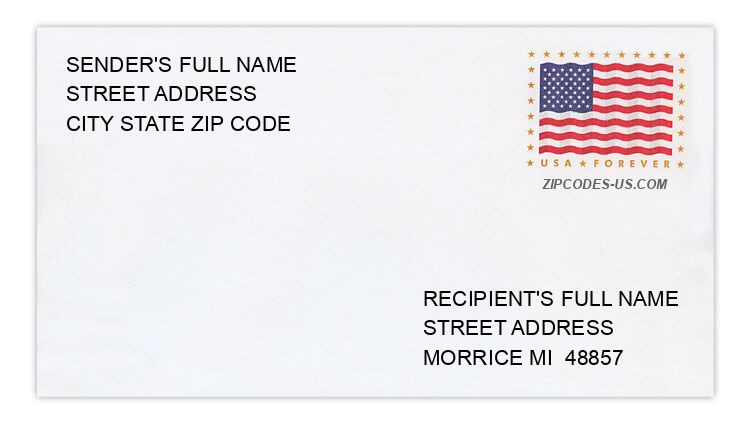
The recipient address information is provided for your reference.
Address example
10700 BENNETT DR
MORRICE MI 48857-9792
MORRICE MI 48857-9792
120 E MASON
MORRICE MI 48857-2557
MORRICE MI 48857-2557
2074 E WINEGAR RD
MORRICE MI 48857-9750
MORRICE MI 48857-9750
379 S RUBY CT
MORRICE MI 48857-8752
MORRICE MI 48857-8752
188 W ELLSWORTH RD
MORRICE MI 48857-9780
MORRICE MI 48857-9780
123 W MASON
MORRICE MI 48857-2526
MORRICE MI 48857-2526
Map
Hover over the map to see the ZIP code
Census data for MORRICE, MI
Demographic and housing estimates in MORRICE, MI
| Total population | 1,210 |
| Male | 558 |
| Female | 652 |
| Total population | 1,210 |
| Under 5 years | 128 |
| 5 to 9 years | 115 |
| 10 to 14 years | 74 |
| 15 to 19 years | 59 |
| 20 to 24 years | 39 |
| 25 to 34 years | 167 |
| 35 to 44 years | 181 |
| 45 to 54 years | 203 |
| 55 to 59 years | 71 |
| 60 to 64 years | 27 |
| 65 to 74 years | 106 |
| 75 to 84 years | 40 |
| 85 years and over | 0 |
| Median age (years) | 36.7 |
| Under 18 years | 363 |
| 16 years and over | 879 |
| 18 years and over | 847 |
| 21 years and over | 827 |
| 62 years and over | 161 |
| 65 years and over | 146 |
| Total population | 1,210 |
| One race | 1,184 |
| White | 1,172 |
| Black or African American | 0 |
| American Indian and Alaska Native | 6 |
| Asian | 6 |
| Native Hawaiian and Other Pacific Islander | 0 |
| Some other race | 0 |
| Two or more races | 26 |
| Citizen, VOTING AGE 18 and over population | 847 |
| Male Citizen, VOTING AGE 18 and over population | 405 |
| Female Citizen, VOTING AGE 18 and over population | 442 |
Social characteristics in MORRICE, MI
| Total households | 415 |
| Family households (families) | 335 |
| Married-couple family | 272 |
| Male householder, no wife present, family | 33 |
| Female householder, no husband present, family | 30 |
| Nonfamily households | 80 |
| Average household size | 2.92 |
| Average family size | 3.25 |
Economic characteristics in MORRICE, MI
| Total households | 415 |
| Less than $10,000 | 5 |
| $10,000 to $14,999 | 9 |
| $15,000 to $24,999 | 22 |
| $25,000 to $34,999 | 31 |
| $35,000 to $49,999 | 61 |
| $50,000 to $74,999 | 101 |
| $75,000 to $99,999 | 110 |
| $100,000 to $149,999 | 53 |
| $150,000 to $199,999 | 15 |
| $200,000 or more | 8 |
| Median household income (dollars) | 67,813 |
Housing characteristics in MORRICE, MI
| Total housing units | 469 |
| Occupied housing units | 415 |
| Vacant housing units | 54 |
| Total housing units | 469 |
| 1-unit, detached | 316 |
| 1-unit, attached | 0 |
| 2 units | 10 |
| 3 or 4 units | 15 |
| 5 to 9 units | 0 |
| 10 to 19 units | 0 |
| 20 or more units | 0 |
| Mobile home | 128 |
| Boat, RV, van, etc. | 0 |
| Total housing units | 469 |
| Built 2014 or later | 0 |
| Built 2010 to 2013 | 6 |
| Built 2000 to 2009 | 103 |
| Built 1990 to 1999 | 105 |
| Built 1980 to 1989 | 18 |
| Built 1970 to 1979 | 68 |
| Built 1960 to 1969 | 50 |
| Built 1950 to 1959 | 8 |
| Built 1940 to 1949 | 7 |
| Built 1939 or earlier | 104 |
| Total housing units | 469 |
| 1 room | 0 |
| 2 rooms | 5 |
| 3 rooms | 12 |
| 4 rooms | 26 |
| 5 rooms | 108 |
| 6 rooms | 156 |
| 7 rooms | 62 |
| 8 rooms | 48 |
| 9 rooms or more | 52 |
| Median rooms | 6.0 |
| Total housing units | 469 |
| No bedroom | 0 |
| 1 bedroom | 29 |
| 2 bedrooms | 50 |
| 3 bedrooms | 303 |
| 4 bedrooms | 73 |
| 5 or more bedrooms | 14 |
| Occupied housing units | 415 |
| Owner-occupied | 319 |
| Renter-occupied | 96 |
| Average household size of owner-occupied unit | 3.03 |
| Average household size of renter-occupied unit | 2.54 |
| Occupied housing units | 415 |
| Moved in 2017 or later | 3 |
| Moved in 2015 to 2016 | 48 |
| Moved in 2010 to 2014 | 137 |
| Moved in 2000 to 2009 | 119 |
| Moved in 1990 to 1999 | 55 |
| Moved in 1989 and earlier | 53 |
| Owner-occupied units | 319 |
| Less than $50,000 | 62 |
| $50,000 to $99,999 | 109 |
| $100,000 to $149,999 | 91 |
| $150,000 to $199,999 | 47 |
| $200,000 to $299,999 | 5 |
| $300,000 to $499,999 | 5 |
| $500,000 to $999,999 | 0 |
| $1,000,000 or more | 0 |
| Median (dollars) | 96,600 |
| Owner-occupied units | 319 |
| Housing units with a mortgage | 237 |
| Housing units without a mortgage | 82 |
| Occupied units paying rent | 93 |
| Less than $500 | 0 |
| $500 to $999 | 90 |
| $1,000 to $1,499 | 3 |
| $1,500 to $1,999 | 0 |
| $2,000 to $2,499 | 0 |
| $2,500 to $2,999 | 0 |
| $3,000 or more | 0 |
| Median (dollars) | 683 |
| No rent paid | 3 |
Data is based on 2018 Census
ZIP Codes for other locations
State for MORRICE
Michigan ZIP CodesOther cities in Michigan