BURLINGTON, NC ZIP Code
| City | BURLINGTON |
| State | North Carolina |
| ZIP Codes count | 3 (see all) |
| Post offices count | 2 (see all) |
| Total population | 52,524 (see all) |
ZIP Codes in BURLINGTON, North Carolina
27215, 27216, 27217
This list contains only 5-digit ZIP codes. Use our zip code lookup by address feature to get the full 9-digit (ZIP+4) code.
List of BURLINGTON, NC ZIP Codes
| ZIP | TYPE | POPU |
|---|---|---|
| 27215 | STANDARD | 45,191 |
| 27216 | PO BOX | – |
| 27217 | STANDARD | 38,575 |
Post offices
BURLINGTON — Post Office™ 405 MAPLE AVE BURLINGTON, NC 27215-5993 |
NORTH BURLINGTON — Post Office™ 2212 N CHURCH ST BURLINGTON, NC 27217-3179 |
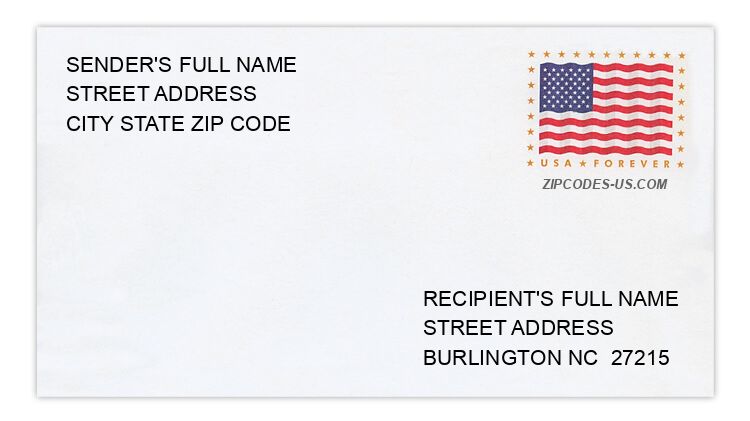
Envelope example
On the bottom center of the envelope, write the address you want your letter delivered to. Include the following on separate lines:
- Recipient's full name
- Full street address
- City, State, and ZIP Code
Using the same format, write the return address in the top left corner.
Using the full ZIP+4 Code when mailing via the USPS ensures the fastest, most accurate mailing possible. If you are not sure of the full 9-digit ZIP Code, use the 5-digit ZIP Code to avoid loss of letter or package.
The recipient address information is provided for your reference.
Address example
2903 ANITA CT
BURLINGTON NC 27215-8801
BURLINGTON NC 27215-8801
737 EDEN ST
BURLINGTON NC 27215-3670
BURLINGTON NC 27215-3670
934 FLEEMAN LN
BURLINGTON NC 27217-8714
BURLINGTON NC 27217-8714
184 LOCHMADDY DR
BURLINGTON NC 27215-9806
BURLINGTON NC 27215-9806
85 NEALS HILLS RD
BURLINGTON NC 27217-7789
BURLINGTON NC 27217-7789
1701 SYKES ST
BURLINGTON NC 27215-5616
BURLINGTON NC 27215-5616
Map
Hover over the map to see the ZIP code
Census data for BURLINGTON, NC
Demographic and housing estimates in BURLINGTON, NC
| Total population | 52,524 |
| Male | 24,604 |
| Female | 27,920 |
| Total population | 52,524 |
| Under 5 years | 3,113 |
| 5 to 9 years | 3,039 |
| 10 to 14 years | 3,524 |
| 15 to 19 years | 2,954 |
| 20 to 24 years | 3,293 |
| 25 to 34 years | 7,606 |
| 35 to 44 years | 6,061 |
| 45 to 54 years | 7,021 |
| 55 to 59 years | 3,443 |
| 60 to 64 years | 3,051 |
| 65 to 74 years | 5,371 |
| 75 to 84 years | 2,600 |
| 85 years and over | 1,448 |
| Median age (years) | 39.9 |
| Under 18 years | 11,270 |
| 16 years and over | 42,373 |
| 18 years and over | 41,254 |
| 21 years and over | 39,187 |
| 62 years and over | 11,208 |
| 65 years and over | 9,419 |
| Total population | 52,524 |
| One race | 51,385 |
| White | 30,004 |
| Black or African American | 14,565 |
| American Indian and Alaska Native | 74 |
| Asian | 1,719 |
| Native Hawaiian and Other Pacific Islander | 36 |
| Some other race | 4,987 |
| Two or more races | 1,139 |
| Citizen, VOTING AGE 18 and over population | 37,090 |
| Male Citizen, VOTING AGE 18 and over population | 16,751 |
| Female Citizen, VOTING AGE 18 and over population | 20,339 |
Social characteristics in BURLINGTON, NC
| Total households | 22,211 |
| Family households (families) | 12,918 |
| Married-couple family | 7,969 |
| Male householder, no wife present, family | 1,069 |
| Female householder, no husband present, family | 3,880 |
| Nonfamily households | 9,293 |
| Average household size | 2.32 |
| Average family size | 3.01 |
Economic characteristics in BURLINGTON, NC
| Total households | 22,211 |
| Less than $10,000 | 1,986 |
| $10,000 to $14,999 | 1,628 |
| $15,000 to $24,999 | 3,280 |
| $25,000 to $34,999 | 2,764 |
| $35,000 to $49,999 | 3,779 |
| $50,000 to $74,999 | 3,455 |
| $75,000 to $99,999 | 2,049 |
| $100,000 to $149,999 | 2,125 |
| $150,000 to $199,999 | 704 |
| $200,000 or more | 441 |
| Median household income (dollars) | 40,061 |
Housing characteristics in BURLINGTON, NC
| Total housing units | 24,580 |
| Occupied housing units | 22,211 |
| Vacant housing units | 2,369 |
| Total housing units | 24,580 |
| 1-unit, detached | 15,301 |
| 1-unit, attached | 974 |
| 2 units | 1,297 |
| 3 or 4 units | 1,292 |
| 5 to 9 units | 1,777 |
| 10 to 19 units | 1,714 |
| 20 or more units | 1,427 |
| Mobile home | 798 |
| Boat, RV, van, etc. | 0 |
| Total housing units | 24,580 |
| Built 2014 or later | 312 |
| Built 2010 to 2013 | 782 |
| Built 2000 to 2009 | 3,894 |
| Built 1990 to 1999 | 2,638 |
| Built 1980 to 1989 | 2,303 |
| Built 1970 to 1979 | 2,928 |
| Built 1960 to 1969 | 3,302 |
| Built 1950 to 1959 | 4,906 |
| Built 1940 to 1949 | 1,894 |
| Built 1939 or earlier | 1,621 |
| Total housing units | 24,580 |
| 1 room | 246 |
| 2 rooms | 511 |
| 3 rooms | 2,308 |
| 4 rooms | 5,573 |
| 5 rooms | 5,970 |
| 6 rooms | 4,013 |
| 7 rooms | 2,657 |
| 8 rooms | 1,446 |
| 9 rooms or more | 1,856 |
| Median rooms | 5.1 |
| Total housing units | 24,580 |
| No bedroom | 268 |
| 1 bedroom | 2,888 |
| 2 bedrooms | 7,847 |
| 3 bedrooms | 10,613 |
| 4 bedrooms | 2,383 |
| 5 or more bedrooms | 581 |
| Occupied housing units | 22,211 |
| Owner-occupied | 11,340 |
| Renter-occupied | 10,871 |
| Average household size of owner-occupied unit | 2.48 |
| Average household size of renter-occupied unit | 2.15 |
| Occupied housing units | 22,211 |
| Moved in 2017 or later | 1,438 |
| Moved in 2015 to 2016 | 3,002 |
| Moved in 2010 to 2014 | 7,435 |
| Moved in 2000 to 2009 | 5,028 |
| Moved in 1990 to 1999 | 2,166 |
| Moved in 1989 and earlier | 3,142 |
| Owner-occupied units | 11,340 |
| Less than $50,000 | 848 |
| $50,000 to $99,999 | 2,990 |
| $100,000 to $149,999 | 2,811 |
| $150,000 to $199,999 | 2,039 |
| $200,000 to $299,999 | 1,358 |
| $300,000 to $499,999 | 1,019 |
| $500,000 to $999,999 | 236 |
| $1,000,000 or more | 39 |
| Median (dollars) | 126,300 |
| Owner-occupied units | 11,340 |
| Housing units with a mortgage | 6,764 |
| Housing units without a mortgage | 4,576 |
| Occupied units paying rent | 10,274 |
| Less than $500 | 1,547 |
| $500 to $999 | 6,568 |
| $1,000 to $1,499 | 1,678 |
| $1,500 to $1,999 | 290 |
| $2,000 to $2,499 | 38 |
| $2,500 to $2,999 | 90 |
| $3,000 or more | 63 |
| Median (dollars) | 797 |
| No rent paid | 597 |
Data is based on 2018 Census
ZIP Codes for other locations
State for BURLINGTON
North Carolina ZIP CodesOther cities in North Carolina