CONWAY, NH ZIP Code
| City | CONWAY |
| State | New Hampshire |
| ZIP Codes count | 1 (see all) |
| Post offices count | 1 (see all) |
| Total population | 3,838 (see all) |
ZIP Code in CONWAY, New Hampshire
03818
This list contains only 5-digit ZIP codes. Use our zip code lookup by address feature to get the full 9-digit (ZIP+4) code.
List of CONWAY, NH ZIP Codes
| ZIP | TYPE | POPU |
|---|---|---|
| 03818 | STANDARD | 4,098 |
Post offices
CONWAY — Post Office™ 175 MAIN ST CONWAY, NH 03818-9998 |
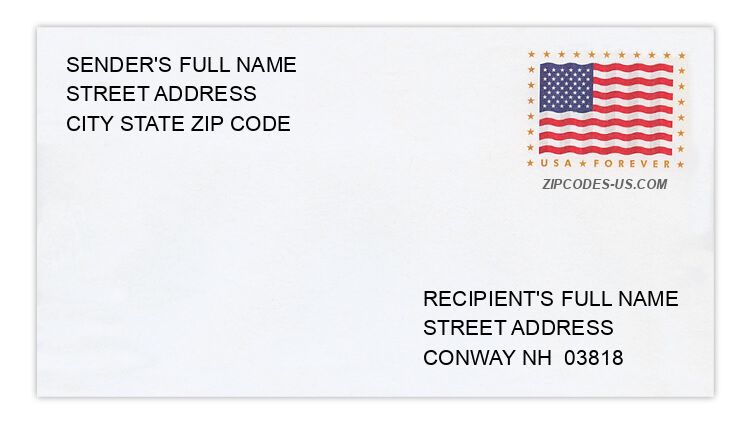
Envelope example
On the bottom center of the envelope, write the address you want your letter delivered to. Include the following on separate lines:
- Recipient's full name
- Full street address
- City, State, and ZIP Code
Using the same format, write the return address in the top left corner.
Using the full ZIP+4 Code when mailing via the USPS ensures the fastest, most accurate mailing possible. If you are not sure of the full 9-digit ZIP Code, use the 5-digit ZIP Code to avoid loss of letter or package.
The recipient address information is provided for your reference.
Address example
43 H ST
CONWAY NH 03818-6244
CONWAY NH 03818-6244
89 JACKSON AVE
CONWAY NH 03818-6135
CONWAY NH 03818-6135
33 PONDWOOD DR
CONWAY NH 03818-6191
CONWAY NH 03818-6191
4 VFW ST
CONWAY NH 03818-6125
CONWAY NH 03818-6125
473 W MAIN ST
CONWAY NH 03818-6241
CONWAY NH 03818-6241
29 W MAIN STREET EXT
CONWAY NH 03818-6147
CONWAY NH 03818-6147
Map
Hover over the map to see the ZIP code
Census data for CONWAY, NH
Demographic and housing estimates in CONWAY, NH
| Total population | 3,838 |
| Male | 1,909 |
| Female | 1,929 |
| Total population | 3,838 |
| Under 5 years | 275 |
| 5 to 9 years | 349 |
| 10 to 14 years | 368 |
| 15 to 19 years | 74 |
| 20 to 24 years | 16 |
| 25 to 34 years | 613 |
| 35 to 44 years | 460 |
| 45 to 54 years | 316 |
| 55 to 59 years | 336 |
| 60 to 64 years | 405 |
| 65 to 74 years | 376 |
| 75 to 84 years | 181 |
| 85 years and over | 69 |
| Median age (years) | 38.8 |
| Under 18 years | 1,004 |
| 16 years and over | 2,846 |
| 18 years and over | 2,834 |
| 21 years and over | 2,772 |
| 62 years and over | 901 |
| 65 years and over | 626 |
| Total population | 3,838 |
| One race | 3,782 |
| White | 3,694 |
| Black or African American | 1 |
| American Indian and Alaska Native | 0 |
| Asian | 87 |
| Native Hawaiian and Other Pacific Islander | 0 |
| Some other race | 0 |
| Two or more races | 56 |
| Citizen, VOTING AGE 18 and over population | 2,732 |
| Male Citizen, VOTING AGE 18 and over population | 1,312 |
| Female Citizen, VOTING AGE 18 and over population | 1,420 |
Social characteristics in CONWAY, NH
| Total households | 1,751 |
| Family households (families) | 1,081 |
| Married-couple family | 773 |
| Male householder, no wife present, family | 0 |
| Female householder, no husband present, family | 308 |
| Nonfamily households | 670 |
| Average household size | 2.19 |
| Average family size | 2.75 |
Economic characteristics in CONWAY, NH
| Total households | 1,751 |
| Less than $10,000 | 124 |
| $10,000 to $14,999 | 177 |
| $15,000 to $24,999 | 161 |
| $25,000 to $34,999 | 310 |
| $35,000 to $49,999 | 183 |
| $50,000 to $74,999 | 331 |
| $75,000 to $99,999 | 163 |
| $100,000 to $149,999 | 186 |
| $150,000 to $199,999 | 96 |
| $200,000 or more | 20 |
| Median household income (dollars) | 47,716 |
Housing characteristics in CONWAY, NH
| Total housing units | 2,250 |
| Occupied housing units | 1,751 |
| Vacant housing units | 499 |
| Total housing units | 2,250 |
| 1-unit, detached | 1,269 |
| 1-unit, attached | 0 |
| 2 units | 43 |
| 3 or 4 units | 103 |
| 5 to 9 units | 278 |
| 10 to 19 units | 9 |
| 20 or more units | 187 |
| Mobile home | 361 |
| Boat, RV, van, etc. | 0 |
| Total housing units | 2,250 |
| Built 2014 or later | 0 |
| Built 2010 to 2013 | 76 |
| Built 2000 to 2009 | 351 |
| Built 1990 to 1999 | 95 |
| Built 1980 to 1989 | 544 |
| Built 1970 to 1979 | 317 |
| Built 1960 to 1969 | 144 |
| Built 1950 to 1959 | 108 |
| Built 1940 to 1949 | 87 |
| Built 1939 or earlier | 528 |
| Total housing units | 2,250 |
| 1 room | 29 |
| 2 rooms | 21 |
| 3 rooms | 447 |
| 4 rooms | 417 |
| 5 rooms | 522 |
| 6 rooms | 461 |
| 7 rooms | 196 |
| 8 rooms | 86 |
| 9 rooms or more | 71 |
| Median rooms | 4.9 |
| Total housing units | 2,250 |
| No bedroom | 29 |
| 1 bedroom | 374 |
| 2 bedrooms | 794 |
| 3 bedrooms | 859 |
| 4 bedrooms | 155 |
| 5 or more bedrooms | 39 |
| Occupied housing units | 1,751 |
| Owner-occupied | 1,144 |
| Renter-occupied | 607 |
| Average household size of owner-occupied unit | 2.41 |
| Average household size of renter-occupied unit | 1.76 |
| Occupied housing units | 1,751 |
| Moved in 2017 or later | 101 |
| Moved in 2015 to 2016 | 124 |
| Moved in 2010 to 2014 | 724 |
| Moved in 2000 to 2009 | 400 |
| Moved in 1990 to 1999 | 219 |
| Moved in 1989 and earlier | 183 |
| Owner-occupied units | 1,144 |
| Less than $50,000 | 140 |
| $50,000 to $99,999 | 220 |
| $100,000 to $149,999 | 133 |
| $150,000 to $199,999 | 368 |
| $200,000 to $299,999 | 199 |
| $300,000 to $499,999 | 9 |
| $500,000 to $999,999 | 75 |
| $1,000,000 or more | 0 |
| Median (dollars) | 159,800 |
| Owner-occupied units | 1,144 |
| Housing units with a mortgage | 561 |
| Housing units without a mortgage | 583 |
| Occupied units paying rent | 573 |
| Less than $500 | 62 |
| $500 to $999 | 389 |
| $1,000 to $1,499 | 113 |
| $1,500 to $1,999 | 9 |
| $2,000 to $2,499 | 0 |
| $2,500 to $2,999 | 0 |
| $3,000 or more | 0 |
| Median (dollars) | 907 |
| No rent paid | 34 |
Data is based on 2018 Census
ZIP Codes for other locations
State for CONWAY
New Hampshire ZIP CodesOther cities in New Hampshire