MONTVALE, NJ ZIP Code
| City | MONTVALE |
| State | New Jersey |
| ZIP Codes count | 1 (see all) |
| Post offices count | 1 (see all) |
| Total population | 8,438 (see all) |
ZIP Code in MONTVALE, New Jersey
07645
This list contains only 5-digit ZIP codes. Use our zip code lookup by address feature to get the full 9-digit (ZIP+4) code.
List of MONTVALE, NJ ZIP Codes
| ZIP | TYPE | POPU |
|---|---|---|
| 07645 | STANDARD | 8,413 |
Post offices
MONTVALE — Post Office™ 22 W GRAND AVE MONTVALE, NJ 07645-9998 |
Envelope example
On the bottom center of the envelope, write the address you want your letter delivered to. Include the following on separate lines:
- Recipient's full name
- Full street address
- City, State, and ZIP Code
Using the same format, write the return address in the top left corner.
Using the full ZIP+4 Code when mailing via the USPS ensures the fastest, most accurate mailing possible. If you are not sure of the full 9-digit ZIP Code, use the 5-digit ZIP Code to avoid loss of letter or package.
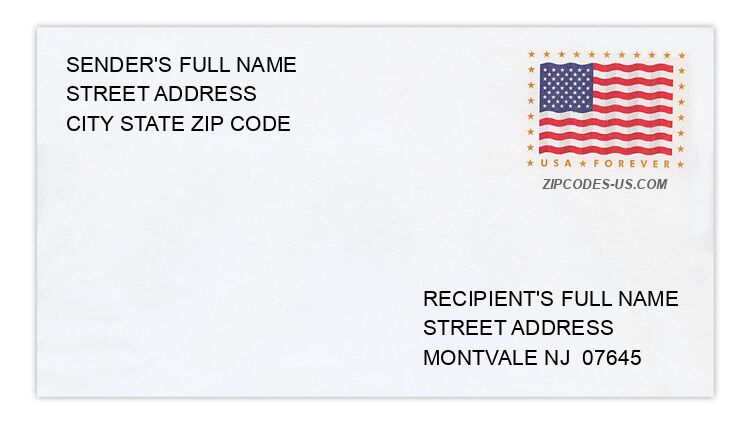
The recipient address information is provided for your reference.
Address example
81 CREST DR
MONTVALE NJ 07645-2301
MONTVALE NJ 07645-2301
15 FLINTLOCK RD
MONTVALE NJ 07645-1372
MONTVALE NJ 07645-1372
47 HILLCREST AVE
MONTVALE NJ 07645-2208
MONTVALE NJ 07645-2208
63 RUTHERFORD PL
MONTVALE NJ 07645-2327
MONTVALE NJ 07645-2327
76 SUNRISE DR
MONTVALE NJ 07645-1030
MONTVALE NJ 07645-1030
191 WOODLAND RD
MONTVALE NJ 07645-1331
MONTVALE NJ 07645-1331
Map
Hover over the map to see the ZIP code
Census data for MONTVALE, NJ
Demographic and housing estimates in MONTVALE, NJ
| Total population | 8,438 |
| Male | 3,873 |
| Female | 4,565 |
| Total population | 8,438 |
| Under 5 years | 414 |
| 5 to 9 years | 509 |
| 10 to 14 years | 722 |
| 15 to 19 years | 610 |
| 20 to 24 years | 473 |
| 25 to 34 years | 685 |
| 35 to 44 years | 877 |
| 45 to 54 years | 1,677 |
| 55 to 59 years | 542 |
| 60 to 64 years | 380 |
| 65 to 74 years | 822 |
| 75 to 84 years | 532 |
| 85 years and over | 195 |
| Median age (years) | 43.8 |
| Under 18 years | 2,097 |
| 16 years and over | 6,682 |
| 18 years and over | 6,341 |
| 21 years and over | 6,146 |
| 62 years and over | 1,676 |
| 65 years and over | 1,549 |
| Total population | 8,438 |
| One race | 8,318 |
| White | 6,542 |
| Black or African American | 272 |
| American Indian and Alaska Native | 0 |
| Asian | 1,222 |
| Native Hawaiian and Other Pacific Islander | 0 |
| Some other race | 282 |
| Two or more races | 120 |
| Citizen, VOTING AGE 18 and over population | 5,959 |
| Male Citizen, VOTING AGE 18 and over population | 2,721 |
| Female Citizen, VOTING AGE 18 and over population | 3,238 |
Social characteristics in MONTVALE, NJ
| Total households | 2,858 |
| Family households (families) | 2,310 |
| Married-couple family | 1,728 |
| Male householder, no wife present, family | 272 |
| Female householder, no husband present, family | 310 |
| Nonfamily households | 548 |
| Average household size | 2.95 |
| Average family size | 3.35 |
Economic characteristics in MONTVALE, NJ
| Total households | 2,858 |
| Less than $10,000 | 90 |
| $10,000 to $14,999 | 39 |
| $15,000 to $24,999 | 149 |
| $25,000 to $34,999 | 33 |
| $35,000 to $49,999 | 96 |
| $50,000 to $74,999 | 395 |
| $75,000 to $99,999 | 269 |
| $100,000 to $149,999 | 603 |
| $150,000 to $199,999 | 416 |
| $200,000 or more | 768 |
| Median household income (dollars) | 128,641 |
Housing characteristics in MONTVALE, NJ
| Total housing units | 2,879 |
| Occupied housing units | 2,858 |
| Vacant housing units | 21 |
| Total housing units | 2,879 |
| 1-unit, detached | 2,106 |
| 1-unit, attached | 288 |
| 2 units | 61 |
| 3 or 4 units | 159 |
| 5 to 9 units | 110 |
| 10 to 19 units | 137 |
| 20 or more units | 18 |
| Mobile home | 0 |
| Boat, RV, van, etc. | 0 |
| Total housing units | 2,879 |
| Built 2014 or later | 61 |
| Built 2010 to 2013 | 170 |
| Built 2000 to 2009 | 278 |
| Built 1990 to 1999 | 224 |
| Built 1980 to 1989 | 186 |
| Built 1970 to 1979 | 297 |
| Built 1960 to 1969 | 924 |
| Built 1950 to 1959 | 396 |
| Built 1940 to 1949 | 37 |
| Built 1939 or earlier | 306 |
| Total housing units | 2,879 |
| 1 room | 18 |
| 2 rooms | 18 |
| 3 rooms | 162 |
| 4 rooms | 160 |
| 5 rooms | 368 |
| 6 rooms | 436 |
| 7 rooms | 412 |
| 8 rooms | 499 |
| 9 rooms or more | 806 |
| Median rooms | 7.2 |
| Total housing units | 2,879 |
| No bedroom | 18 |
| 1 bedroom | 205 |
| 2 bedrooms | 498 |
| 3 bedrooms | 1,065 |
| 4 bedrooms | 678 |
| 5 or more bedrooms | 415 |
| Occupied housing units | 2,858 |
| Owner-occupied | 2,401 |
| Renter-occupied | 457 |
| Average household size of owner-occupied unit | 2.98 |
| Average household size of renter-occupied unit | 2.78 |
| Occupied housing units | 2,858 |
| Moved in 2017 or later | 77 |
| Moved in 2015 to 2016 | 114 |
| Moved in 2010 to 2014 | 544 |
| Moved in 2000 to 2009 | 947 |
| Moved in 1990 to 1999 | 561 |
| Moved in 1989 and earlier | 615 |
| Owner-occupied units | 2,401 |
| Less than $50,000 | 23 |
| $50,000 to $99,999 | 0 |
| $100,000 to $149,999 | 15 |
| $150,000 to $199,999 | 76 |
| $200,000 to $299,999 | 47 |
| $300,000 to $499,999 | 578 |
| $500,000 to $999,999 | 1,392 |
| $1,000,000 or more | 270 |
| Median (dollars) | 615,800 |
| Owner-occupied units | 2,401 |
| Housing units with a mortgage | 1,487 |
| Housing units without a mortgage | 914 |
| Occupied units paying rent | 450 |
| Less than $500 | 0 |
| $500 to $999 | 29 |
| $1,000 to $1,499 | 118 |
| $1,500 to $1,999 | 158 |
| $2,000 to $2,499 | 46 |
| $2,500 to $2,999 | 15 |
| $3,000 or more | 84 |
| Median (dollars) | 1,747 |
| No rent paid | 7 |
Data is based on 2018 Census
ZIP Codes for other locations
State for MONTVALE
New Jersey ZIP CodesOther cities in New Jersey