DAYTON, NV ZIP Code
| City | DAYTON |
| State | Nevada |
| ZIP Codes count | 1 (see all) |
| Post offices count | 1 (see all) |
| Total population | 9,508 (see all) |
ZIP Code in DAYTON, Nevada
89403
This list contains only 5-digit ZIP codes. Use our zip code lookup by address feature to get the full 9-digit (ZIP+4) code.
List of DAYTON, NV ZIP Codes
| ZIP | TYPE | POPU |
|---|---|---|
| 89403 | STANDARD | 16,550 |
Post offices
DAYTON — Post Office™ 50 FOURTH AVE DAYTON, NV 89403-9998 |
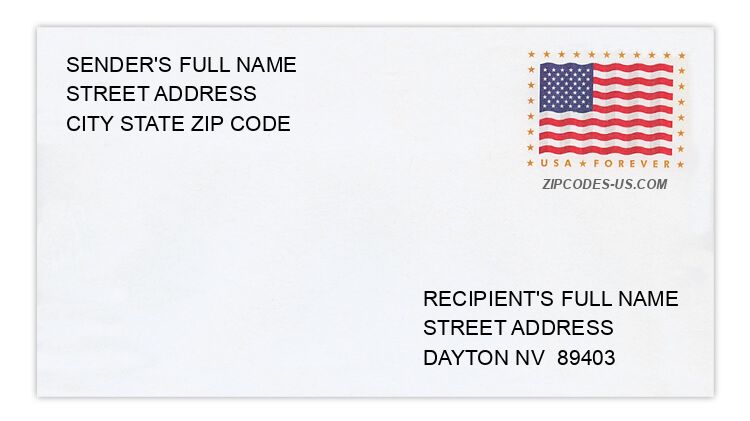
Envelope example
On the bottom center of the envelope, write the address you want your letter delivered to. Include the following on separate lines:
- Recipient's full name
- Full street address
- City, State, and ZIP Code
Using the same format, write the return address in the top left corner.
Using the full ZIP+4 Code when mailing via the USPS ensures the fastest, most accurate mailing possible. If you are not sure of the full 9-digit ZIP Code, use the 5-digit ZIP Code to avoid loss of letter or package.
The recipient address information is provided for your reference.
Address example
26 COLUMBIA DR
DAYTON NV 89403-4303
DAYTON NV 89403-4303
749 EMPIRE RD
DAYTON NV 89403-8048
DAYTON NV 89403-8048
327 SNOW LN
DAYTON NV 89403-7738
DAYTON NV 89403-7738
304 SUTRO SPRINGS RD
DAYTON NV 89403-9704
DAYTON NV 89403-9704
130 TOWNSEND ST
DAYTON NV 89403-6615
DAYTON NV 89403-6615
173 TYLER ST
DAYTON NV 89403-6631
DAYTON NV 89403-6631
Map
Hover over the map to see the ZIP code
Census data for DAYTON, NV
Demographic and housing estimates in DAYTON, NV
| Total population | 9,508 |
| Male | 4,834 |
| Female | 4,674 |
| Total population | 9,508 |
| Under 5 years | 704 |
| 5 to 9 years | 629 |
| 10 to 14 years | 333 |
| 15 to 19 years | 485 |
| 20 to 24 years | 540 |
| 25 to 34 years | 1,304 |
| 35 to 44 years | 1,292 |
| 45 to 54 years | 1,376 |
| 55 to 59 years | 457 |
| 60 to 64 years | 686 |
| 65 to 74 years | 1,175 |
| 75 to 84 years | 414 |
| 85 years and over | 113 |
| Median age (years) | 41.0 |
| Under 18 years | 1,939 |
| 16 years and over | 7,705 |
| 18 years and over | 7,569 |
| 21 years and over | 7,242 |
| 62 years and over | 2,061 |
| 65 years and over | 1,702 |
| Total population | 9,508 |
| One race | 9,227 |
| White | 8,208 |
| Black or African American | 120 |
| American Indian and Alaska Native | 174 |
| Asian | 89 |
| Native Hawaiian and Other Pacific Islander | 0 |
| Some other race | 636 |
| Two or more races | 281 |
| Citizen, VOTING AGE 18 and over population | 7,090 |
| Male Citizen, VOTING AGE 18 and over population | 3,492 |
| Female Citizen, VOTING AGE 18 and over population | 3,598 |
Social characteristics in DAYTON, NV
| Total households | 3,597 |
| Family households (families) | 2,418 |
| Married-couple family | 1,750 |
| Male householder, no wife present, family | 155 |
| Female householder, no husband present, family | 513 |
| Nonfamily households | 1,179 |
| Average household size | 2.64 |
| Average family size | 3.15 |
Economic characteristics in DAYTON, NV
| Total households | 3,597 |
| Less than $10,000 | 132 |
| $10,000 to $14,999 | 188 |
| $15,000 to $24,999 | 223 |
| $25,000 to $34,999 | 357 |
| $35,000 to $49,999 | 486 |
| $50,000 to $74,999 | 749 |
| $75,000 to $99,999 | 535 |
| $100,000 to $149,999 | 714 |
| $150,000 to $199,999 | 123 |
| $200,000 or more | 90 |
| Median household income (dollars) | 63,278 |
Housing characteristics in DAYTON, NV
| Total housing units | 3,850 |
| Occupied housing units | 3,597 |
| Vacant housing units | 253 |
| Total housing units | 3,850 |
| 1-unit, detached | 3,022 |
| 1-unit, attached | 138 |
| 2 units | 57 |
| 3 or 4 units | 137 |
| 5 to 9 units | 115 |
| 10 to 19 units | 0 |
| 20 or more units | 19 |
| Mobile home | 354 |
| Boat, RV, van, etc. | 8 |
| Total housing units | 3,850 |
| Built 2014 or later | 158 |
| Built 2010 to 2013 | 63 |
| Built 2000 to 2009 | 1,520 |
| Built 1990 to 1999 | 1,154 |
| Built 1980 to 1989 | 546 |
| Built 1970 to 1979 | 254 |
| Built 1960 to 1969 | 77 |
| Built 1950 to 1959 | 16 |
| Built 1940 to 1949 | 0 |
| Built 1939 or earlier | 62 |
| Total housing units | 3,850 |
| 1 room | 8 |
| 2 rooms | 42 |
| 3 rooms | 103 |
| 4 rooms | 690 |
| 5 rooms | 863 |
| 6 rooms | 1,127 |
| 7 rooms | 454 |
| 8 rooms | 321 |
| 9 rooms or more | 242 |
| Median rooms | 5.7 |
| Total housing units | 3,850 |
| No bedroom | 8 |
| 1 bedroom | 125 |
| 2 bedrooms | 689 |
| 3 bedrooms | 2,121 |
| 4 bedrooms | 805 |
| 5 or more bedrooms | 102 |
| Occupied housing units | 3,597 |
| Owner-occupied | 2,343 |
| Renter-occupied | 1,254 |
| Average household size of owner-occupied unit | 2.57 |
| Average household size of renter-occupied unit | 2.79 |
| Occupied housing units | 3,597 |
| Moved in 2017 or later | 199 |
| Moved in 2015 to 2016 | 472 |
| Moved in 2010 to 2014 | 1,533 |
| Moved in 2000 to 2009 | 846 |
| Moved in 1990 to 1999 | 330 |
| Moved in 1989 and earlier | 217 |
| Owner-occupied units | 2,343 |
| Less than $50,000 | 97 |
| $50,000 to $99,999 | 100 |
| $100,000 to $149,999 | 245 |
| $150,000 to $199,999 | 440 |
| $200,000 to $299,999 | 910 |
| $300,000 to $499,999 | 441 |
| $500,000 to $999,999 | 110 |
| $1,000,000 or more | 0 |
| Median (dollars) | 230,700 |
| Owner-occupied units | 2,343 |
| Housing units with a mortgage | 1,622 |
| Housing units without a mortgage | 721 |
| Occupied units paying rent | 1,185 |
| Less than $500 | 31 |
| $500 to $999 | 613 |
| $1,000 to $1,499 | 489 |
| $1,500 to $1,999 | 52 |
| $2,000 to $2,499 | 0 |
| $2,500 to $2,999 | 0 |
| $3,000 or more | 0 |
| Median (dollars) | 949 |
| No rent paid | 69 |
Data is based on 2018 Census
ZIP Codes for other locations
State for DAYTON
Nevada ZIP CodesOther cities in Nevada