FALLON, NV ZIP Code
| City | FALLON |
| State | Nevada |
| ZIP Codes count | 3 (see all) |
| Post offices count | 2 (see all) |
| Total population | 8,330 (see all) |
ZIP Codes in FALLON, Nevada
89406, 89407, 89496
This list contains only 5-digit ZIP codes. Use our zip code lookup by address feature to get the full 9-digit (ZIP+4) code.
List of FALLON, NV ZIP Codes
| ZIP | TYPE | POPU |
|---|---|---|
| 89406 | STANDARD | 24,973 |
| 89407 | PO BOX | – |
| 89496 | UNIQUE | – |
Post offices
FALLON — Post Office™ 120 N MAINE ST FALLON, NV 89406-2930 |
PONY EXPRESS — Post Office™ 120 S ALLEN RD FALLON, NV 89406-3275 |
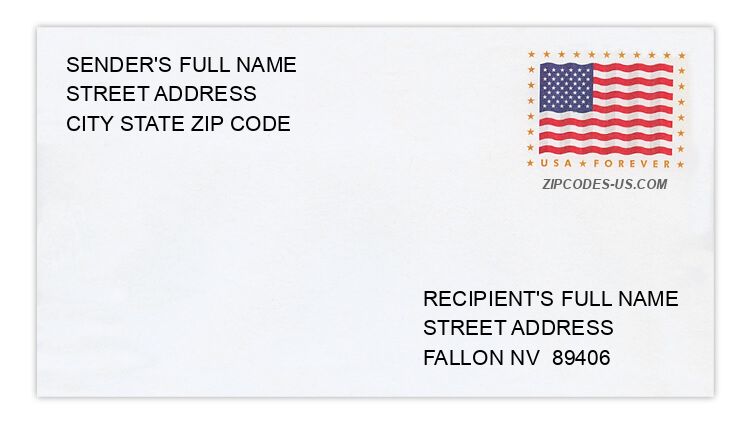
Envelope example
On the bottom center of the envelope, write the address you want your letter delivered to. Include the following on separate lines:
- Recipient's full name
- Full street address
- City, State, and ZIP Code
Using the same format, write the return address in the top left corner.
Using the full ZIP+4 Code when mailing via the USPS ensures the fastest, most accurate mailing possible. If you are not sure of the full 9-digit ZIP Code, use the 5-digit ZIP Code to avoid loss of letter or package.
The recipient address information is provided for your reference.
Address example
906 CONCORD AVE
FALLON NV 89406-3618
FALLON NV 89406-3618
2489 JONATHON CIR
FALLON NV 89406-7904
FALLON NV 89406-7904
640 LESLIE CT
FALLON NV 89406-7196
FALLON NV 89406-7196
7062 LETER RD
FALLON NV 89406-6424
FALLON NV 89406-6424
893 MESQUITE LN
FALLON NV 89406-9033
FALLON NV 89406-9033
1336 ONDA VERDE DR
FALLON NV 89406-7430
FALLON NV 89406-7430
Map
Hover over the map to see the ZIP code
Census data for FALLON, NV
Demographic and housing estimates in FALLON, NV
| Total population | 8,330 |
| Male | 4,088 |
| Female | 4,242 |
| Total population | 8,330 |
| Under 5 years | 718 |
| 5 to 9 years | 525 |
| 10 to 14 years | 388 |
| 15 to 19 years | 573 |
| 20 to 24 years | 627 |
| 25 to 34 years | 1,337 |
| 35 to 44 years | 1,009 |
| 45 to 54 years | 983 |
| 55 to 59 years | 687 |
| 60 to 64 years | 345 |
| 65 to 74 years | 684 |
| 75 to 84 years | 364 |
| 85 years and over | 90 |
| Median age (years) | 34.9 |
| Under 18 years | 2,044 |
| 16 years and over | 6,517 |
| 18 years and over | 6,286 |
| 21 years and over | 6,033 |
| 62 years and over | 1,272 |
| 65 years and over | 1,138 |
| Total population | 8,330 |
| One race | 7,872 |
| White | 6,910 |
| Black or African American | 306 |
| American Indian and Alaska Native | 172 |
| Asian | 367 |
| Native Hawaiian and Other Pacific Islander | 26 |
| Some other race | 91 |
| Two or more races | 458 |
| Citizen, VOTING AGE 18 and over population | 6,055 |
| Male Citizen, VOTING AGE 18 and over population | 2,989 |
| Female Citizen, VOTING AGE 18 and over population | 3,066 |
Social characteristics in FALLON, NV
| Total households | 3,567 |
| Family households (families) | 1,907 |
| Married-couple family | 1,319 |
| Male householder, no wife present, family | 277 |
| Female householder, no husband present, family | 311 |
| Nonfamily households | 1,660 |
| Average household size | 2.28 |
| Average family size | 3.09 |
Economic characteristics in FALLON, NV
| Total households | 3,567 |
| Less than $10,000 | 343 |
| $10,000 to $14,999 | 201 |
| $15,000 to $24,999 | 447 |
| $25,000 to $34,999 | 410 |
| $35,000 to $49,999 | 686 |
| $50,000 to $74,999 | 519 |
| $75,000 to $99,999 | 427 |
| $100,000 to $149,999 | 427 |
| $150,000 to $199,999 | 27 |
| $200,000 or more | 80 |
| Median household income (dollars) | 42,934 |
Housing characteristics in FALLON, NV
| Total housing units | 3,913 |
| Occupied housing units | 3,567 |
| Vacant housing units | 346 |
| Total housing units | 3,913 |
| 1-unit, detached | 2,477 |
| 1-unit, attached | 154 |
| 2 units | 114 |
| 3 or 4 units | 379 |
| 5 to 9 units | 207 |
| 10 to 19 units | 13 |
| 20 or more units | 335 |
| Mobile home | 229 |
| Boat, RV, van, etc. | 5 |
| Total housing units | 3,913 |
| Built 2014 or later | 18 |
| Built 2010 to 2013 | 11 |
| Built 2000 to 2009 | 713 |
| Built 1990 to 1999 | 765 |
| Built 1980 to 1989 | 785 |
| Built 1970 to 1979 | 839 |
| Built 1960 to 1969 | 264 |
| Built 1950 to 1959 | 160 |
| Built 1940 to 1949 | 222 |
| Built 1939 or earlier | 136 |
| Total housing units | 3,913 |
| 1 room | 9 |
| 2 rooms | 157 |
| 3 rooms | 544 |
| 4 rooms | 745 |
| 5 rooms | 1,247 |
| 6 rooms | 672 |
| 7 rooms | 269 |
| 8 rooms | 140 |
| 9 rooms or more | 130 |
| Median rooms | 4.9 |
| Total housing units | 3,913 |
| No bedroom | 9 |
| 1 bedroom | 569 |
| 2 bedrooms | 1,143 |
| 3 bedrooms | 1,668 |
| 4 bedrooms | 468 |
| 5 or more bedrooms | 56 |
| Occupied housing units | 3,567 |
| Owner-occupied | 1,482 |
| Renter-occupied | 2,085 |
| Average household size of owner-occupied unit | 2.14 |
| Average household size of renter-occupied unit | 2.37 |
| Occupied housing units | 3,567 |
| Moved in 2017 or later | 308 |
| Moved in 2015 to 2016 | 942 |
| Moved in 2010 to 2014 | 1,058 |
| Moved in 2000 to 2009 | 819 |
| Moved in 1990 to 1999 | 255 |
| Moved in 1989 and earlier | 185 |
| Owner-occupied units | 1,482 |
| Less than $50,000 | 120 |
| $50,000 to $99,999 | 295 |
| $100,000 to $149,999 | 396 |
| $150,000 to $199,999 | 300 |
| $200,000 to $299,999 | 239 |
| $300,000 to $499,999 | 118 |
| $500,000 to $999,999 | 14 |
| $1,000,000 or more | 0 |
| Median (dollars) | 144,000 |
| Owner-occupied units | 1,482 |
| Housing units with a mortgage | 1,048 |
| Housing units without a mortgage | 434 |
| Occupied units paying rent | 1,974 |
| Less than $500 | 260 |
| $500 to $999 | 1,045 |
| $1,000 to $1,499 | 522 |
| $1,500 to $1,999 | 134 |
| $2,000 to $2,499 | 0 |
| $2,500 to $2,999 | 13 |
| $3,000 or more | 0 |
| Median (dollars) | 824 |
| No rent paid | 111 |
Data is based on 2018 Census
ZIP Codes for other locations
State for FALLON
Nevada ZIP CodesOther cities in Nevada