KINGS PARK, NY ZIP Code
| City | KINGS PARK |
| State | New York |
| ZIP Codes count | 1 (see all) |
| Post offices count | 1 (see all) |
| Total population | 16,707 (see all) |
ZIP Code in KINGS PARK, New York
11754
This list contains only 5-digit ZIP codes. Use our zip code lookup by address feature to get the full 9-digit (ZIP+4) code.
List of KINGS PARK, NY ZIP Codes
| ZIP | TYPE | POPU |
|---|---|---|
| 11754 | STANDARD | 17,884 |
Post offices
KINGS PARK — Post Office™ 125 E MAIN ST KINGS PARK, NY 11754-3819 |
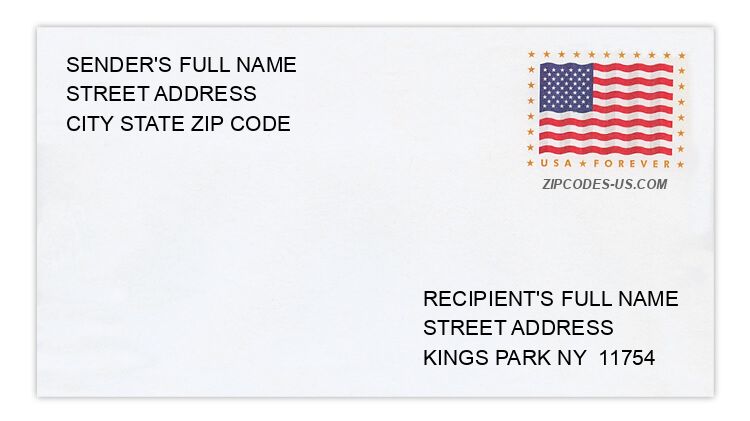
Envelope example
On the bottom center of the envelope, write the address you want your letter delivered to. Include the following on separate lines:
- Recipient's full name
- Full street address
- City, State, and ZIP Code
Using the same format, write the return address in the top left corner.
Using the full ZIP+4 Code when mailing via the USPS ensures the fastest, most accurate mailing possible. If you are not sure of the full 9-digit ZIP Code, use the 5-digit ZIP Code to avoid loss of letter or package.
The recipient address information is provided for your reference.
Address example
74 DAWSON AVE
KINGS PARK NY 11754-1514
KINGS PARK NY 11754-1514
40 DELANO LN
KINGS PARK NY 11754-2815
KINGS PARK NY 11754-2815
49 GOLD ST
KINGS PARK NY 11754-1505
KINGS PARK NY 11754-1505
46 HEATHER DR
KINGS PARK NY 11754-1208
KINGS PARK NY 11754-1208
18 PARK WOODS LN
KINGS PARK NY 11754-4601
KINGS PARK NY 11754-4601
305 SUNKEN MEADOW RD
KINGS PARK NY 11754-1000
KINGS PARK NY 11754-1000
Map
Hover over the map to see the ZIP code
Census data for KINGS PARK, NY
Demographic and housing estimates in KINGS PARK, NY
| Total population | 16,707 |
| Male | 7,780 |
| Female | 8,927 |
| Total population | 16,707 |
| Under 5 years | 719 |
| 5 to 9 years | 897 |
| 10 to 14 years | 1,099 |
| 15 to 19 years | 1,014 |
| 20 to 24 years | 854 |
| 25 to 34 years | 1,662 |
| 35 to 44 years | 2,039 |
| 45 to 54 years | 2,615 |
| 55 to 59 years | 1,058 |
| 60 to 64 years | 1,301 |
| 65 to 74 years | 1,854 |
| 75 to 84 years | 1,074 |
| 85 years and over | 521 |
| Median age (years) | 45.5 |
| Under 18 years | 3,449 |
| 16 years and over | 13,700 |
| 18 years and over | 13,258 |
| 21 years and over | 12,829 |
| 62 years and over | 4,205 |
| 65 years and over | 3,449 |
| Total population | 16,707 |
| One race | 16,528 |
| White | 15,073 |
| Black or African American | 237 |
| American Indian and Alaska Native | 6 |
| Asian | 772 |
| Native Hawaiian and Other Pacific Islander | 0 |
| Some other race | 440 |
| Two or more races | 179 |
| Citizen, VOTING AGE 18 and over population | 13,051 |
| Male Citizen, VOTING AGE 18 and over population | 6,021 |
| Female Citizen, VOTING AGE 18 and over population | 7,030 |
Social characteristics in KINGS PARK, NY
| Total households | 6,071 |
| Family households (families) | 4,292 |
| Married-couple family | 3,676 |
| Male householder, no wife present, family | 139 |
| Female householder, no husband present, family | 477 |
| Nonfamily households | 1,779 |
| Average household size | 2.69 |
| Average family size | 3.29 |
Economic characteristics in KINGS PARK, NY
| Total households | 6,071 |
| Less than $10,000 | 179 |
| $10,000 to $14,999 | 115 |
| $15,000 to $24,999 | 385 |
| $25,000 to $34,999 | 342 |
| $35,000 to $49,999 | 531 |
| $50,000 to $74,999 | 655 |
| $75,000 to $99,999 | 714 |
| $100,000 to $149,999 | 1,287 |
| $150,000 to $199,999 | 734 |
| $200,000 or more | 1,129 |
| Median household income (dollars) | 103,666 |
Housing characteristics in KINGS PARK, NY
| Total housing units | 6,608 |
| Occupied housing units | 6,071 |
| Vacant housing units | 537 |
| Total housing units | 6,608 |
| 1-unit, detached | 5,010 |
| 1-unit, attached | 537 |
| 2 units | 288 |
| 3 or 4 units | 227 |
| 5 to 9 units | 254 |
| 10 to 19 units | 80 |
| 20 or more units | 187 |
| Mobile home | 8 |
| Boat, RV, van, etc. | 17 |
| Total housing units | 6,608 |
| Built 2014 or later | 0 |
| Built 2010 to 2013 | 5 |
| Built 2000 to 2009 | 358 |
| Built 1990 to 1999 | 503 |
| Built 1980 to 1989 | 778 |
| Built 1970 to 1979 | 1,096 |
| Built 1960 to 1969 | 2,011 |
| Built 1950 to 1959 | 1,143 |
| Built 1940 to 1949 | 377 |
| Built 1939 or earlier | 337 |
| Total housing units | 6,608 |
| 1 room | 73 |
| 2 rooms | 298 |
| 3 rooms | 297 |
| 4 rooms | 561 |
| 5 rooms | 676 |
| 6 rooms | 1,335 |
| 7 rooms | 979 |
| 8 rooms | 1,242 |
| 9 rooms or more | 1,147 |
| Median rooms | 6.6 |
| Total housing units | 6,608 |
| No bedroom | 97 |
| 1 bedroom | 744 |
| 2 bedrooms | 663 |
| 3 bedrooms | 2,731 |
| 4 bedrooms | 1,892 |
| 5 or more bedrooms | 481 |
| Occupied housing units | 6,071 |
| Owner-occupied | 4,877 |
| Renter-occupied | 1,194 |
| Average household size of owner-occupied unit | 2.89 |
| Average household size of renter-occupied unit | 1.87 |
| Occupied housing units | 6,071 |
| Moved in 2017 or later | 160 |
| Moved in 2015 to 2016 | 367 |
| Moved in 2010 to 2014 | 1,039 |
| Moved in 2000 to 2009 | 1,562 |
| Moved in 1990 to 1999 | 1,332 |
| Moved in 1989 and earlier | 1,611 |
| Owner-occupied units | 4,877 |
| Less than $50,000 | 153 |
| $50,000 to $99,999 | 48 |
| $100,000 to $149,999 | 16 |
| $150,000 to $199,999 | 51 |
| $200,000 to $299,999 | 227 |
| $300,000 to $499,999 | 3,194 |
| $500,000 to $999,999 | 1,140 |
| $1,000,000 or more | 48 |
| Median (dollars) | 437,200 |
| Owner-occupied units | 4,877 |
| Housing units with a mortgage | 3,243 |
| Housing units without a mortgage | 1,634 |
| Occupied units paying rent | 1,078 |
| Less than $500 | 33 |
| $500 to $999 | 127 |
| $1,000 to $1,499 | 377 |
| $1,500 to $1,999 | 264 |
| $2,000 to $2,499 | 193 |
| $2,500 to $2,999 | 67 |
| $3,000 or more | 17 |
| Median (dollars) | 1,504 |
| No rent paid | 116 |
Data is based on 2018 Census
ZIP Codes for other locations
State for KINGS PARK
New York ZIP CodesOther cities in New York