BARTLETT, TX ZIP Code
| City | BARTLETT |
| State | Texas |
| ZIP Codes count | 1 (see all) |
| Post offices count | 1 (see all) |
| Total population | 2,002 (see all) |
ZIP Code in BARTLETT, Texas
76511
This list contains only 5-digit ZIP codes. Use our zip code lookup by address feature to get the full 9-digit (ZIP+4) code.
List of BARTLETT, TX ZIP Codes
| ZIP | TYPE | POPU |
|---|---|---|
| 76511 | STANDARD | 2,497 |
Post offices
BARTLETT — Post Office™ 131 N EVIE ST BARTLETT, TX 76511-9998 |
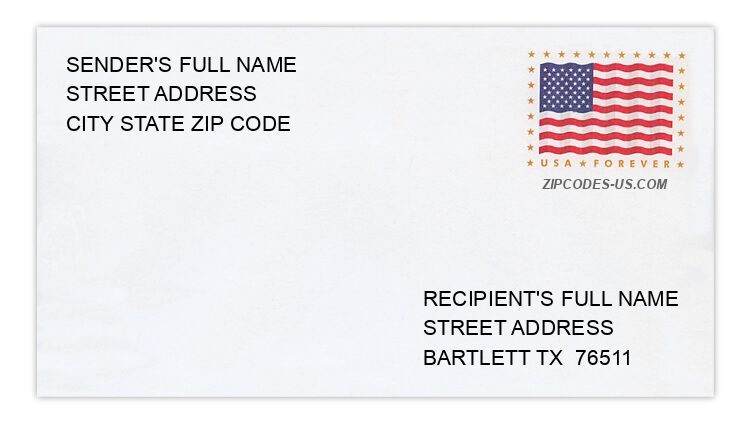
Envelope example
On the bottom center of the envelope, write the address you want your letter delivered to. Include the following on separate lines:
- Recipient's full name
- Full street address
- City, State, and ZIP Code
Using the same format, write the return address in the top left corner.
Using the full ZIP+4 Code when mailing via the USPS ensures the fastest, most accurate mailing possible. If you are not sure of the full 9-digit ZIP Code, use the 5-digit ZIP Code to avoid loss of letter or package.
The recipient address information is provided for your reference.
Address example
3181 COUNTY ROAD 352
BARTLETT TX 76511-4016
BARTLETT TX 76511-4016
527 E CLARK ST
BARTLETT TX 76511-4262
BARTLETT TX 76511-4262
20959 KELSOVILLE RD
BARTLETT TX 76511-4074
BARTLETT TX 76511-4074
513 KIMBLE RD
BARTLETT TX 76511-4512
BARTLETT TX 76511-4512
6699 N FORK RD
BARTLETT TX 76511-4079
BARTLETT TX 76511-4079
234 PRIVATE ROAD 4008
BARTLETT TX 76511-4475
BARTLETT TX 76511-4475
Map
Hover over the map to see the ZIP code
Census data for BARTLETT, TX
Demographic and housing estimates in BARTLETT, TX
| Total population | 2,002 |
| Male | 1,319 |
| Female | 683 |
| Total population | 2,002 |
| Under 5 years | 122 |
| 5 to 9 years | 93 |
| 10 to 14 years | 88 |
| 15 to 19 years | 71 |
| 20 to 24 years | 204 |
| 25 to 34 years | 401 |
| 35 to 44 years | 246 |
| 45 to 54 years | 300 |
| 55 to 59 years | 122 |
| 60 to 64 years | 93 |
| 65 to 74 years | 141 |
| 75 to 84 years | 42 |
| 85 years and over | 79 |
| Median age (years) | 35.7 |
| Under 18 years | 343 |
| 16 years and over | 1,686 |
| 18 years and over | 1,659 |
| 21 years and over | 1,603 |
| 62 years and over | 336 |
| 65 years and over | 262 |
| Total population | 2,002 |
| One race | 1,905 |
| White | 1,465 |
| Black or African American | 413 |
| American Indian and Alaska Native | 0 |
| Asian | 0 |
| Native Hawaiian and Other Pacific Islander | 0 |
| Some other race | 27 |
| Two or more races | 97 |
| Citizen, VOTING AGE 18 and over population | 1,577 |
| Male Citizen, VOTING AGE 18 and over population | 1,051 |
| Female Citizen, VOTING AGE 18 and over population | 526 |
Social characteristics in BARTLETT, TX
| Total households | 453 |
| Family households (families) | 318 |
| Married-couple family | 231 |
| Male householder, no wife present, family | 42 |
| Female householder, no husband present, family | 45 |
| Nonfamily households | 135 |
| Average household size | 2.85 |
| Average family size | 3.57 |
Economic characteristics in BARTLETT, TX
| Total households | 453 |
| Less than $10,000 | 16 |
| $10,000 to $14,999 | 27 |
| $15,000 to $24,999 | 95 |
| $25,000 to $34,999 | 68 |
| $35,000 to $49,999 | 80 |
| $50,000 to $74,999 | 97 |
| $75,000 to $99,999 | 25 |
| $100,000 to $149,999 | 42 |
| $150,000 to $199,999 | 0 |
| $200,000 or more | 3 |
| Median household income (dollars) | 38,024 |
Housing characteristics in BARTLETT, TX
| Total housing units | 536 |
| Occupied housing units | 453 |
| Vacant housing units | 83 |
| Total housing units | 536 |
| 1-unit, detached | 442 |
| 1-unit, attached | 10 |
| 2 units | 55 |
| 3 or 4 units | 0 |
| 5 to 9 units | 0 |
| 10 to 19 units | 0 |
| 20 or more units | 0 |
| Mobile home | 29 |
| Boat, RV, van, etc. | 0 |
| Total housing units | 536 |
| Built 2014 or later | 14 |
| Built 2010 to 2013 | 0 |
| Built 2000 to 2009 | 68 |
| Built 1990 to 1999 | 26 |
| Built 1980 to 1989 | 59 |
| Built 1970 to 1979 | 56 |
| Built 1960 to 1969 | 55 |
| Built 1950 to 1959 | 71 |
| Built 1940 to 1949 | 71 |
| Built 1939 or earlier | 116 |
| Total housing units | 536 |
| 1 room | 0 |
| 2 rooms | 0 |
| 3 rooms | 32 |
| 4 rooms | 129 |
| 5 rooms | 145 |
| 6 rooms | 107 |
| 7 rooms | 46 |
| 8 rooms | 44 |
| 9 rooms or more | 33 |
| Median rooms | 5.2 |
| Total housing units | 536 |
| No bedroom | 0 |
| 1 bedroom | 43 |
| 2 bedrooms | 220 |
| 3 bedrooms | 188 |
| 4 bedrooms | 85 |
| 5 or more bedrooms | 0 |
| Occupied housing units | 453 |
| Owner-occupied | 299 |
| Renter-occupied | 154 |
| Average household size of owner-occupied unit | 2.76 |
| Average household size of renter-occupied unit | 3.03 |
| Occupied housing units | 453 |
| Moved in 2017 or later | 7 |
| Moved in 2015 to 2016 | 50 |
| Moved in 2010 to 2014 | 149 |
| Moved in 2000 to 2009 | 123 |
| Moved in 1990 to 1999 | 54 |
| Moved in 1989 and earlier | 70 |
| Owner-occupied units | 299 |
| Less than $50,000 | 35 |
| $50,000 to $99,999 | 141 |
| $100,000 to $149,999 | 67 |
| $150,000 to $199,999 | 32 |
| $200,000 to $299,999 | 17 |
| $300,000 to $499,999 | 4 |
| $500,000 to $999,999 | 0 |
| $1,000,000 or more | 3 |
| Median (dollars) | 87,700 |
| Owner-occupied units | 299 |
| Housing units with a mortgage | 117 |
| Housing units without a mortgage | 182 |
| Occupied units paying rent | 134 |
| Less than $500 | 44 |
| $500 to $999 | 80 |
| $1,000 to $1,499 | 10 |
| $1,500 to $1,999 | 0 |
| $2,000 to $2,499 | 0 |
| $2,500 to $2,999 | 0 |
| $3,000 or more | 0 |
| Median (dollars) | 663 |
| No rent paid | 20 |
Data is based on 2018 Census
ZIP Codes for other locations
State for BARTLETT
Texas ZIP CodesOther cities in Texas