BASTROP, TX ZIP Code
| City | BASTROP |
| State | Texas |
| ZIP Codes count | 1 (see all) |
| Post offices count | 1 (see all) |
| Total population | 8,736 (see all) |
ZIP Code in BASTROP, Texas
78602
This list contains only 5-digit ZIP codes. Use our zip code lookup by address feature to get the full 9-digit (ZIP+4) code.
List of BASTROP, TX ZIP Codes
| ZIP | TYPE | POPU |
|---|---|---|
| 78602 | STANDARD | 32,646 |
Post offices
BASTROP — Post Office™ 1106 MAIN ST BASTROP, TX 78602-9998 |
Envelope example
On the bottom center of the envelope, write the address you want your letter delivered to. Include the following on separate lines:
- Recipient's full name
- Full street address
- City, State, and ZIP Code
Using the same format, write the return address in the top left corner.
Using the full ZIP+4 Code when mailing via the USPS ensures the fastest, most accurate mailing possible. If you are not sure of the full 9-digit ZIP Code, use the 5-digit ZIP Code to avoid loss of letter or package.
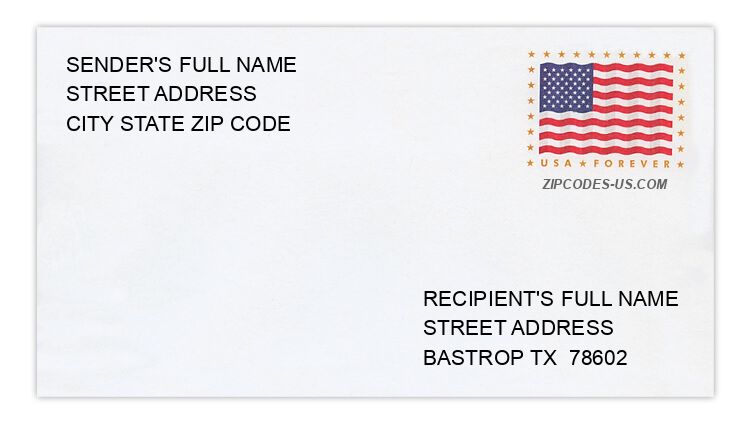
The recipient address information is provided for your reference.
Address example
283 GREEN OAKS DR
BASTROP TX 78602-7666
BASTROP TX 78602-7666
178 HASLER SHORES DR
BASTROP TX 78602-3104
BASTROP TX 78602-3104
144 KAUAI CT
BASTROP TX 78602-7105
BASTROP TX 78602-7105
157 LAAU CT
BASTROP TX 78602-6204
BASTROP TX 78602-6204
228 PINE PATH
BASTROP TX 78602-5816
BASTROP TX 78602-5816
166 SONNY RD
BASTROP TX 78602-3173
BASTROP TX 78602-3173
Map
Hover over the map to see the ZIP code
Census data for BASTROP, TX
Demographic and housing estimates in BASTROP, TX
| Total population | 8,736 |
| Male | 4,537 |
| Female | 4,199 |
| Total population | 8,736 |
| Under 5 years | 539 |
| 5 to 9 years | 214 |
| 10 to 14 years | 711 |
| 15 to 19 years | 910 |
| 20 to 24 years | 669 |
| 25 to 34 years | 777 |
| 35 to 44 years | 1,579 |
| 45 to 54 years | 1,022 |
| 55 to 59 years | 328 |
| 60 to 64 years | 411 |
| 65 to 74 years | 927 |
| 75 to 84 years | 529 |
| 85 years and over | 120 |
| Median age (years) | 38.8 |
| Under 18 years | 1,968 |
| 16 years and over | 7,172 |
| 18 years and over | 6,768 |
| 21 years and over | 6,287 |
| 62 years and over | 1,893 |
| 65 years and over | 1,576 |
| Total population | 8,736 |
| One race | 8,641 |
| White | 7,281 |
| Black or African American | 906 |
| American Indian and Alaska Native | 63 |
| Asian | 171 |
| Native Hawaiian and Other Pacific Islander | 0 |
| Some other race | 220 |
| Two or more races | 95 |
| Citizen, VOTING AGE 18 and over population | 6,511 |
| Male Citizen, VOTING AGE 18 and over population | 3,272 |
| Female Citizen, VOTING AGE 18 and over population | 3,239 |
Social characteristics in BASTROP, TX
| Total households | 3,180 |
| Family households (families) | 2,059 |
| Married-couple family | 1,710 |
| Male householder, no wife present, family | 92 |
| Female householder, no husband present, family | 257 |
| Nonfamily households | 1,121 |
| Average household size | 2.57 |
| Average family size | 3.31 |
Economic characteristics in BASTROP, TX
| Total households | 3,180 |
| Less than $10,000 | 185 |
| $10,000 to $14,999 | 171 |
| $15,000 to $24,999 | 316 |
| $25,000 to $34,999 | 273 |
| $35,000 to $49,999 | 431 |
| $50,000 to $74,999 | 633 |
| $75,000 to $99,999 | 454 |
| $100,000 to $149,999 | 434 |
| $150,000 to $199,999 | 150 |
| $200,000 or more | 133 |
| Median household income (dollars) | 61,538 |
Housing characteristics in BASTROP, TX
| Total housing units | 3,338 |
| Occupied housing units | 3,180 |
| Vacant housing units | 158 |
| Total housing units | 3,338 |
| 1-unit, detached | 2,300 |
| 1-unit, attached | 82 |
| 2 units | 20 |
| 3 or 4 units | 144 |
| 5 to 9 units | 294 |
| 10 to 19 units | 115 |
| 20 or more units | 304 |
| Mobile home | 79 |
| Boat, RV, van, etc. | 0 |
| Total housing units | 3,338 |
| Built 2014 or later | 86 |
| Built 2010 to 2013 | 241 |
| Built 2000 to 2009 | 989 |
| Built 1990 to 1999 | 424 |
| Built 1980 to 1989 | 524 |
| Built 1970 to 1979 | 162 |
| Built 1960 to 1969 | 437 |
| Built 1950 to 1959 | 165 |
| Built 1940 to 1949 | 132 |
| Built 1939 or earlier | 178 |
| Total housing units | 3,338 |
| 1 room | 51 |
| 2 rooms | 90 |
| 3 rooms | 341 |
| 4 rooms | 425 |
| 5 rooms | 940 |
| 6 rooms | 481 |
| 7 rooms | 598 |
| 8 rooms | 275 |
| 9 rooms or more | 137 |
| Median rooms | 5.3 |
| Total housing units | 3,338 |
| No bedroom | 51 |
| 1 bedroom | 312 |
| 2 bedrooms | 950 |
| 3 bedrooms | 1,339 |
| 4 bedrooms | 653 |
| 5 or more bedrooms | 33 |
| Occupied housing units | 3,180 |
| Owner-occupied | 1,725 |
| Renter-occupied | 1,455 |
| Average household size of owner-occupied unit | 2.92 |
| Average household size of renter-occupied unit | 2.16 |
| Occupied housing units | 3,180 |
| Moved in 2017 or later | 245 |
| Moved in 2015 to 2016 | 523 |
| Moved in 2010 to 2014 | 1,587 |
| Moved in 2000 to 2009 | 556 |
| Moved in 1990 to 1999 | 151 |
| Moved in 1989 and earlier | 118 |
| Owner-occupied units | 1,725 |
| Less than $50,000 | 33 |
| $50,000 to $99,999 | 93 |
| $100,000 to $149,999 | 413 |
| $150,000 to $199,999 | 518 |
| $200,000 to $299,999 | 411 |
| $300,000 to $499,999 | 222 |
| $500,000 to $999,999 | 16 |
| $1,000,000 or more | 19 |
| Median (dollars) | 173,300 |
| Owner-occupied units | 1,725 |
| Housing units with a mortgage | 1,142 |
| Housing units without a mortgage | 583 |
| Occupied units paying rent | 1,427 |
| Less than $500 | 156 |
| $500 to $999 | 653 |
| $1,000 to $1,499 | 405 |
| $1,500 to $1,999 | 170 |
| $2,000 to $2,499 | 26 |
| $2,500 to $2,999 | 0 |
| $3,000 or more | 17 |
| Median (dollars) | 941 |
| No rent paid | 28 |
Data is based on 2018 Census
ZIP Codes for other locations
State for BASTROP
Texas ZIP CodesOther cities in Texas