BELLVILLE, TX ZIP Code
| City | BELLVILLE |
| State | Texas |
| ZIP Codes count | 1 (see all) |
| Post offices count | 1 (see all) |
| Total population | 4,234 (see all) |
ZIP Code in BELLVILLE, Texas
77418
This list contains only 5-digit ZIP codes. Use our zip code lookup by address feature to get the full 9-digit (ZIP+4) code.
List of BELLVILLE, TX ZIP Codes
| ZIP | TYPE | POPU |
|---|---|---|
| 77418 | STANDARD | 10,220 |
Post offices
BELLVILLE — Post Office™ 229 E PALM ST BELLVILLE, TX 77418-9998 |
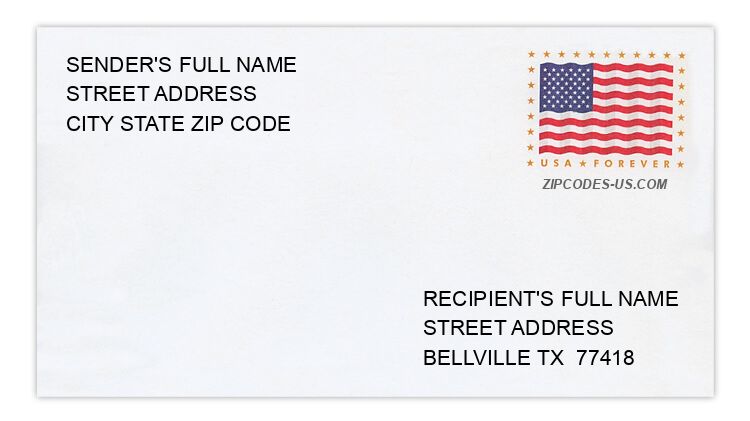
Envelope example
On the bottom center of the envelope, write the address you want your letter delivered to. Include the following on separate lines:
- Recipient's full name
- Full street address
- City, State, and ZIP Code
Using the same format, write the return address in the top left corner.
Using the full ZIP+4 Code when mailing via the USPS ensures the fastest, most accurate mailing possible. If you are not sure of the full 9-digit ZIP Code, use the 5-digit ZIP Code to avoid loss of letter or package.
The recipient address information is provided for your reference.
Address example
778 BADER DR
BELLVILLE TX 77418-4000
BELLVILLE TX 77418-4000
405 BRIARWOOD DR
BELLVILLE TX 77418-3410
BELLVILLE TX 77418-3410
1407 COSHATTE RD
BELLVILLE TX 77418-9822
BELLVILLE TX 77418-9822
582 KENNEY HALL RD
BELLVILLE TX 77418-4372
BELLVILLE TX 77418-4372
3636 REINHARDT RD
BELLVILLE TX 77418-4203
BELLVILLE TX 77418-4203
3775 TEJAS LN
BELLVILLE TX 77418-6575
BELLVILLE TX 77418-6575
Map
Hover over the map to see the ZIP code
Census data for BELLVILLE, TX
Demographic and housing estimates in BELLVILLE, TX
| Total population | 4,234 |
| Male | 1,993 |
| Female | 2,241 |
| Total population | 4,234 |
| Under 5 years | 117 |
| 5 to 9 years | 156 |
| 10 to 14 years | 147 |
| 15 to 19 years | 330 |
| 20 to 24 years | 396 |
| 25 to 34 years | 713 |
| 35 to 44 years | 181 |
| 45 to 54 years | 589 |
| 55 to 59 years | 474 |
| 60 to 64 years | 170 |
| 65 to 74 years | 488 |
| 75 to 84 years | 287 |
| 85 years and over | 186 |
| Median age (years) | 47.7 |
| Under 18 years | 640 |
| 16 years and over | 3,754 |
| 18 years and over | 3,594 |
| 21 years and over | 3,449 |
| 62 years and over | 1,087 |
| 65 years and over | 961 |
| Total population | 4,234 |
| One race | 4,231 |
| White | 3,504 |
| Black or African American | 515 |
| American Indian and Alaska Native | 0 |
| Asian | 0 |
| Native Hawaiian and Other Pacific Islander | 0 |
| Some other race | 212 |
| Two or more races | 3 |
| Citizen, VOTING AGE 18 and over population | 3,249 |
| Male Citizen, VOTING AGE 18 and over population | 1,533 |
| Female Citizen, VOTING AGE 18 and over population | 1,716 |
Social characteristics in BELLVILLE, TX
| Total households | 1,826 |
| Family households (families) | 1,115 |
| Married-couple family | 877 |
| Male householder, no wife present, family | 36 |
| Female householder, no husband present, family | 202 |
| Nonfamily households | 711 |
| Average household size | 2.23 |
| Average family size | 2.86 |
Economic characteristics in BELLVILLE, TX
| Total households | 1,826 |
| Less than $10,000 | 107 |
| $10,000 to $14,999 | 74 |
| $15,000 to $24,999 | 382 |
| $25,000 to $34,999 | 147 |
| $35,000 to $49,999 | 188 |
| $50,000 to $74,999 | 396 |
| $75,000 to $99,999 | 133 |
| $100,000 to $149,999 | 264 |
| $150,000 to $199,999 | 21 |
| $200,000 or more | 114 |
| Median household income (dollars) | 52,632 |
Housing characteristics in BELLVILLE, TX
| Total housing units | 2,022 |
| Occupied housing units | 1,826 |
| Vacant housing units | 196 |
| Total housing units | 2,022 |
| 1-unit, detached | 1,261 |
| 1-unit, attached | 63 |
| 2 units | 164 |
| 3 or 4 units | 286 |
| 5 to 9 units | 48 |
| 10 to 19 units | 60 |
| 20 or more units | 13 |
| Mobile home | 127 |
| Boat, RV, van, etc. | 0 |
| Total housing units | 2,022 |
| Built 2014 or later | 0 |
| Built 2010 to 2013 | 42 |
| Built 2000 to 2009 | 285 |
| Built 1990 to 1999 | 304 |
| Built 1980 to 1989 | 480 |
| Built 1970 to 1979 | 153 |
| Built 1960 to 1969 | 239 |
| Built 1950 to 1959 | 222 |
| Built 1940 to 1949 | 14 |
| Built 1939 or earlier | 283 |
| Total housing units | 2,022 |
| 1 room | 76 |
| 2 rooms | 172 |
| 3 rooms | 77 |
| 4 rooms | 367 |
| 5 rooms | 425 |
| 6 rooms | 230 |
| 7 rooms | 405 |
| 8 rooms | 136 |
| 9 rooms or more | 134 |
| Median rooms | 5.3 |
| Total housing units | 2,022 |
| No bedroom | 76 |
| 1 bedroom | 247 |
| 2 bedrooms | 679 |
| 3 bedrooms | 808 |
| 4 bedrooms | 186 |
| 5 or more bedrooms | 26 |
| Occupied housing units | 1,826 |
| Owner-occupied | 1,049 |
| Renter-occupied | 777 |
| Average household size of owner-occupied unit | 2.08 |
| Average household size of renter-occupied unit | 2.42 |
| Occupied housing units | 1,826 |
| Moved in 2017 or later | 11 |
| Moved in 2015 to 2016 | 163 |
| Moved in 2010 to 2014 | 581 |
| Moved in 2000 to 2009 | 609 |
| Moved in 1990 to 1999 | 248 |
| Moved in 1989 and earlier | 214 |
| Owner-occupied units | 1,049 |
| Less than $50,000 | 55 |
| $50,000 to $99,999 | 96 |
| $100,000 to $149,999 | 150 |
| $150,000 to $199,999 | 302 |
| $200,000 to $299,999 | 283 |
| $300,000 to $499,999 | 129 |
| $500,000 to $999,999 | 34 |
| $1,000,000 or more | 0 |
| Median (dollars) | 191,300 |
| Owner-occupied units | 1,049 |
| Housing units with a mortgage | 506 |
| Housing units without a mortgage | 543 |
| Occupied units paying rent | 739 |
| Less than $500 | 63 |
| $500 to $999 | 539 |
| $1,000 to $1,499 | 126 |
| $1,500 to $1,999 | 11 |
| $2,000 to $2,499 | 0 |
| $2,500 to $2,999 | 0 |
| $3,000 or more | 0 |
| Median (dollars) | 752 |
| No rent paid | 38 |
Data is based on 2018 Census
ZIP Codes for other locations
State for BELLVILLE
Texas ZIP CodesOther cities in Texas